

Ethereum price remained in a bear market as the crypto market continued to weaken ahead of the U.S. consumer inflation report.
Summary
- Ethereum price has moved into a bear market after falling by 60% from its all-time high.
- The Relative Strength Index is approaching the oversold level.
- Ethereum’s staking ratio has jumped to a record high of 30%.
Ethereum (ETH) dropped to $1,985, down by 60% from its highest level in August last year. This is the token’s fourth consecutive week in the red, a move that has shed billions of dollars in value.
Ethereum’s price retreated as demand for its ETFs and futures open interest declined. Data compiled by SoSoValue shows that spot ETH ETFs shed over $129 million in assets on Wednesday, bringing the monthly outflow to over $224 million. It is the fourth consecutive month of outflows, with the cumulative net inflows being $11.75 billion.
More data show that Ethereum’s futures open interest has continued to fall over the past few months. Its open interest dropped to $23 billion, down sharply from last year’s high of over $70 billion. Falling open interest is a sign that investor demand has waned.
However, there are signs that more Ethereum is being moved today to staking pools. Data show that Ethereum staking recently crossed 30% of the total supply for the first time.
More data show that the staking queue has continued soaring in the past few months. There are now over 4 million ETH tokens in the queue waiting to be staked, with less than 25,000 waiting to exit.
Ethereum price prediction: Technical analysis
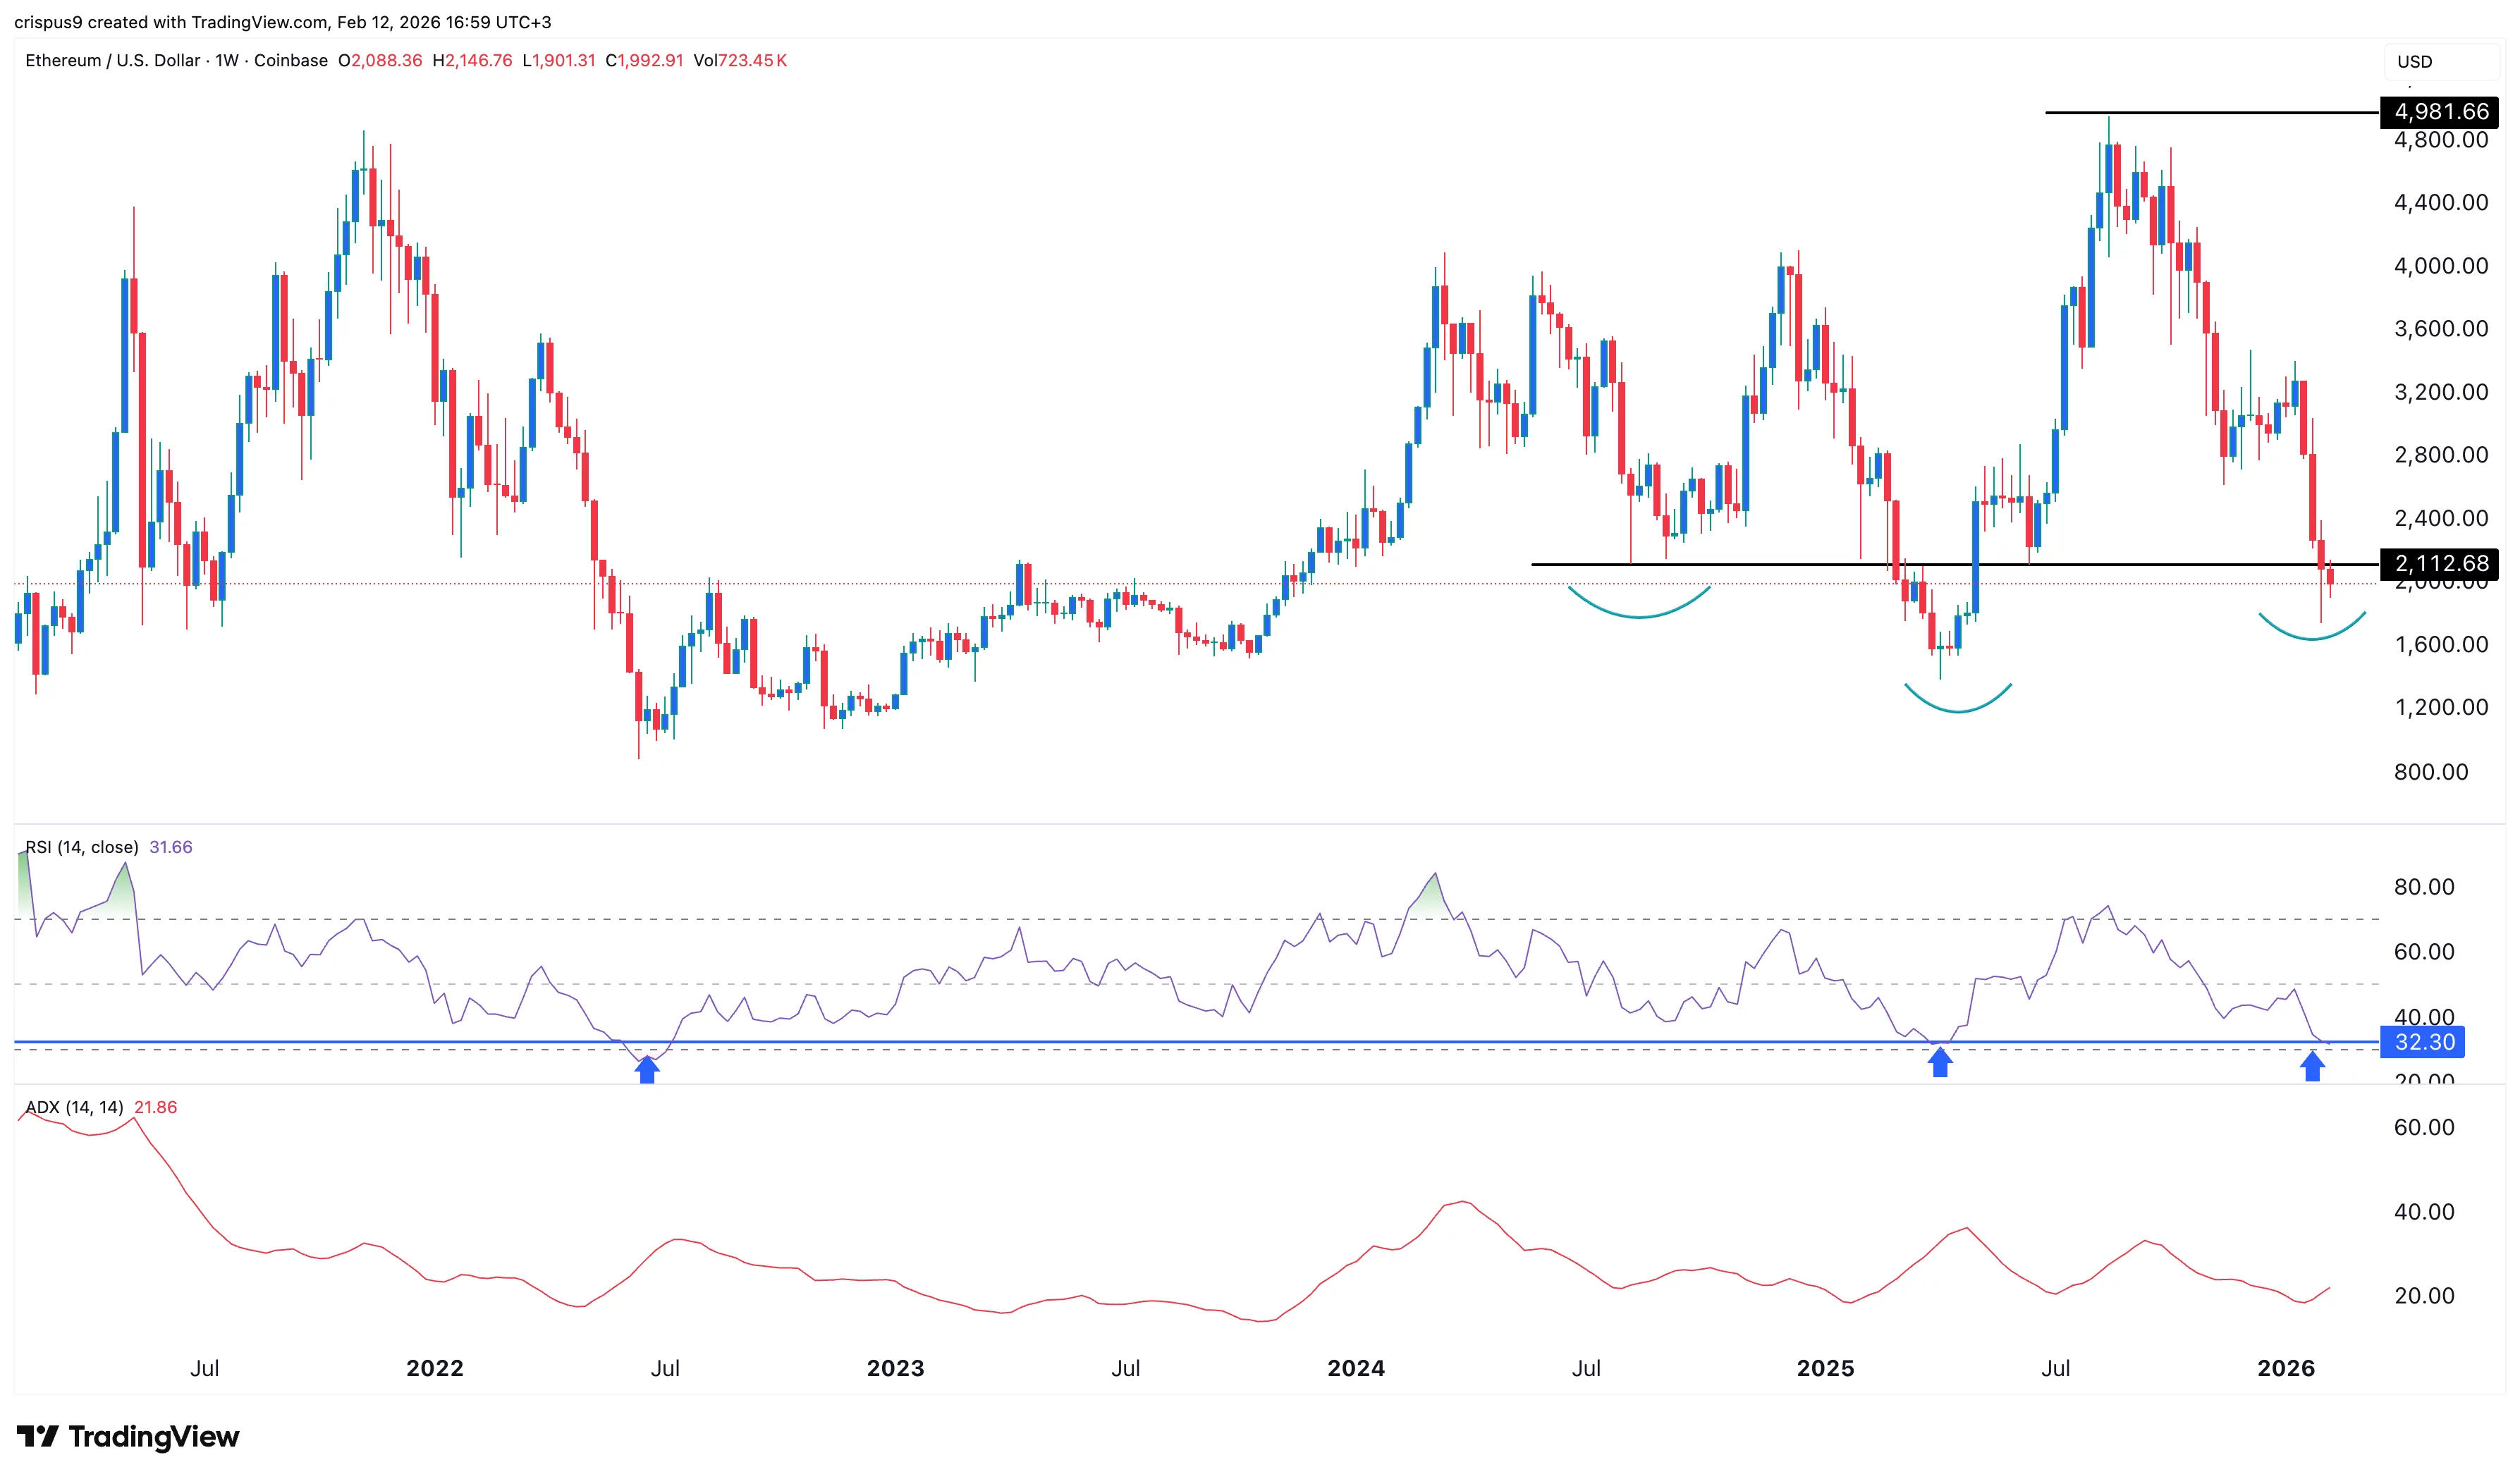
The weekly timeframe chart shows that the ETH price has been in a strong downward trend in the past few months, moving from $4,950 in August to the current $1,988.
It has crashed below the crucial support level at $2,112, its lowest level in August 2024.
On the positive side, the coin has formed an inverted head-and-shoulders pattern, a common bullish reversal sign in technical analysis.
Also, the Average Directional Index has dropped from 33 in July last year to 21 now, a sign that the downtrend is losing momentum.
Most notably, the Relative Strength Index is nearing the oversold level of 30, its lowest level since April last year. Ethereum has often rebounded whenever the RSI has moved into the oversold zone.
Therefore, as Tom Lee noted, there are signs that Ethereum is about to bottom. If this happens, the next level to watch will be the psychological $2,500 level.