

Bitcoin price hovered near the $89,000 mark on Monday, as demand for its spot exchange-traded funds continued to fade.
Summary
- Bitcoin ETFs recorded nearly 4500 million in outflows over the past week.
- BTC price chart hints at a prolonged bearish trend ahead.
According to data from SoSoValue, the 12 spot Bitcoin ETFs recorded $497.05 million in net outflows over the past week, between Dec. 15 and Dec. 19. BlackRock’s IBIT saw the strongest outflows with $240.3 million exiting the fund. Bitwise’s BITB and ARK 21Shares’ ARKB followed with net outflows of $115.1 million and $100.7 million, respectively.
VanEck’s HODL and Grayscale’s GBTC and BTC funds together also contributed to $74.1 million in outflows. Fidelity FBTC managed to buck the trend with $33.1 million in inflows over the week.
Such outflows suggest that institutional demand for these investment products seems to be weakening, a trend that has continued over the past month, during which these funds recorded roughly $3.5 billion in net outflows. This is in stark contrast to the trend observed in October, during which these ETFs had drawn in nearly $7 billion in inflows as Bitcoin hit a new all-time high.
Bitcoin (BTC) dropped 6% from around $90,000 to a weekly low of $84,580 on Friday. It managed to recover back to around $89,800 earlier today, Dec. 22, before bears took over, dragging it back to around $89,100 at press time, up just 1% over the past 24 hours.
Aside from the weak performance of its spot ETFs, Bitcoin price action remains subdued amid thin holiday-season liquidity and macro concerns. Traders are also in wait-and-watch mode ahead of key U.S. macroeconomic releases, including GDP data and jobless claims figures, both of which are set to be released on Thursday, Dec. 25.
On the daily timeframe, Bitcoin has triggered a confluence of bearish signals that historically precede significant market corrections.
Notably, Bitcoin price has been forming a bearish flag since late October this year. At press time, Bitcoin price was close to breaking below the lower trendline of this pattern, a move that typically hints at more downside in the short term.
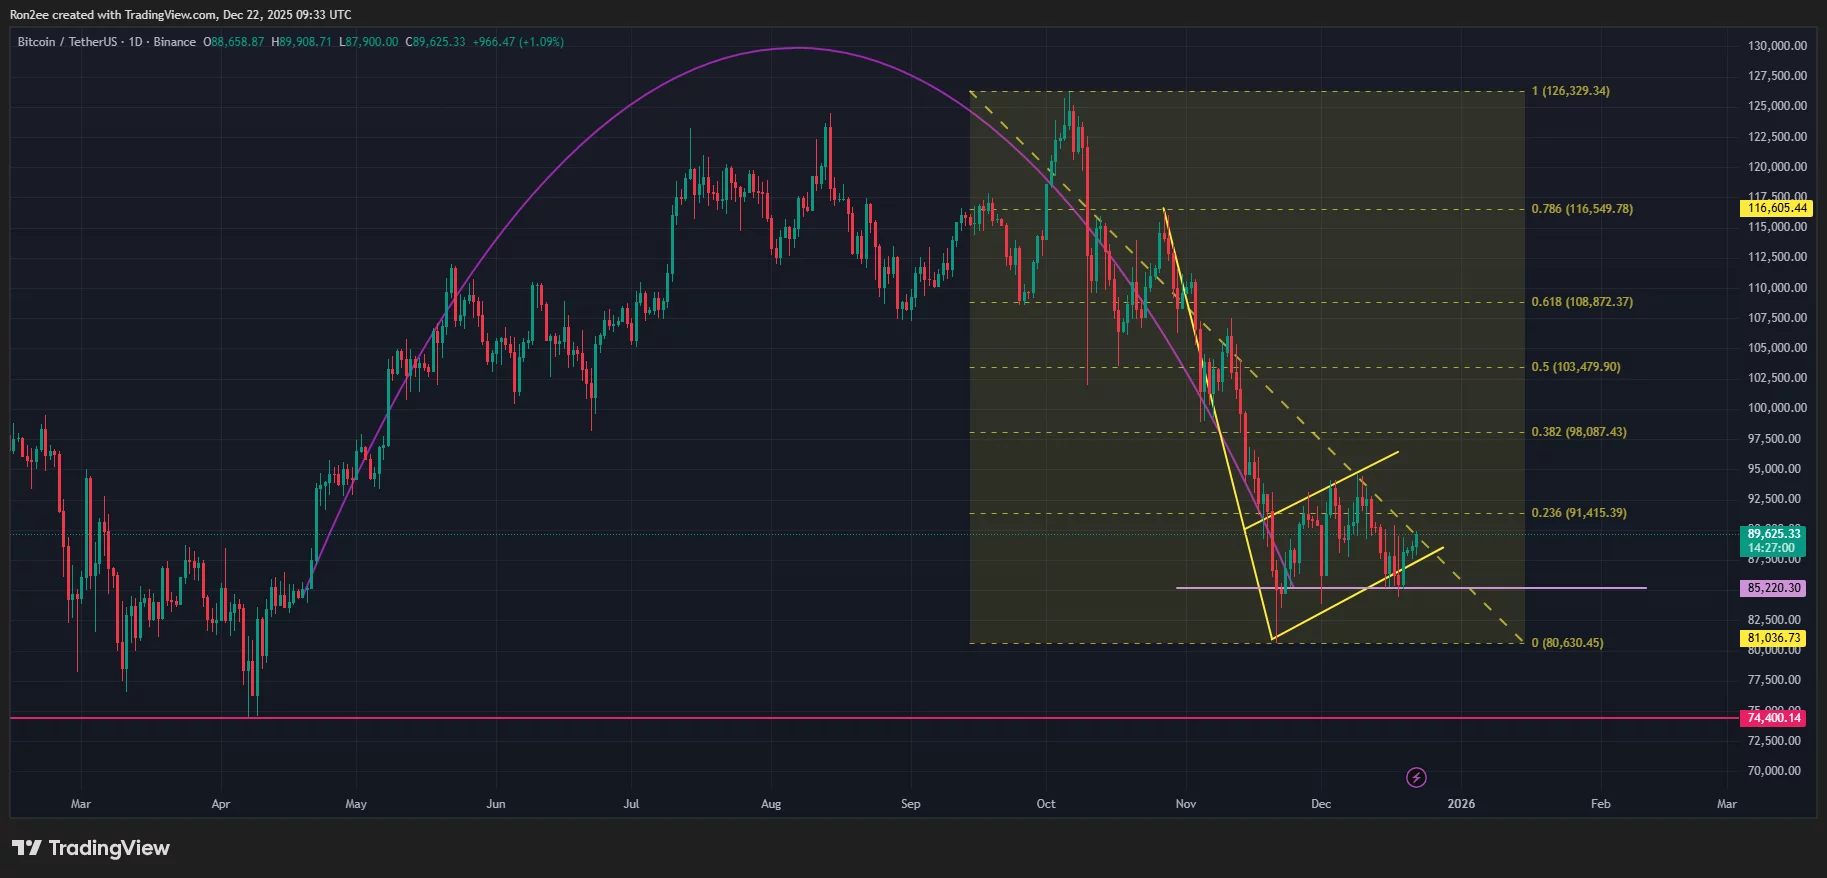
A breakdown from this bearish flag would also likely confirm a breakdown from a much larger inverse cup and handle pattern, as previously reported by crypto.news.
With both of these bearish patterns appearing on the chart, Bitcoin is likely to remain under pressure at least until a clear reversal signal emerges or fundamental catalysts shift the trend.
For now, traders are closely watching the $85,220 level, which serves as the immediate support and has previously acted as a strong price floor where bulls have stepped in to defend against deeper losses. A drop below this support could push prices towards the psychological support at $80k.
On the contrary, $91,415, which aligns with the 23.6% Fibonacci retracement level drawn from its all-time high in October to its sharp drop in November, stands as the key resistance level that bulls need to breach for any meaningful upside move.
Disclosure: This article does not represent investment advice. The content and materials featured on this page are for educational purposes only.