Hedera Hashgraph’s token could be on the verge of a bullish breakout after forming a highly bullish pattern and as a key stablecoin metric rebounds.
Hedera (HBAR) was trading at $0.1525 on July 8, slightly above this month’s low of $0.1255. The current price is still 30% below the March high, placing it in bear market territory.
A potential fundamental catalyst for the HBAR price is that the stablecoin supply in the network has started rising this month. It had a stablecoin supply of over $131 million, its highest level since May 28.
This supply has recovered substantially from last month’s low of $40.2 million, a sign that network activity is growing. Most of these tokens are USD Coin (USDC), followed by the Hedera Swiss Franc coin.
More data shows that Hedera’s total value locked in decentralized finance has also started to rise. TVL has climbed to $168 million, up from $139 million last month. The most improved protocols were Bonzo Finance, Libre Capital, and DaVinciGraph.
Another key development is the SEC’s decision to postpone two HBAR exchange-traded funds while it seeks additional public comments regarding investor protections. The commission delayed Canary’s ETF to September 9 and Grayscale’s to November 11.
Hedera Hashgraph is one of several layer-1 networks aiming to challenge incumbents like Ethereum and Tron. Its primary advantages include high throughput, low transaction costs, and a governance council composed of major global firms such as IBM and Google.
HBAR price technical analysis

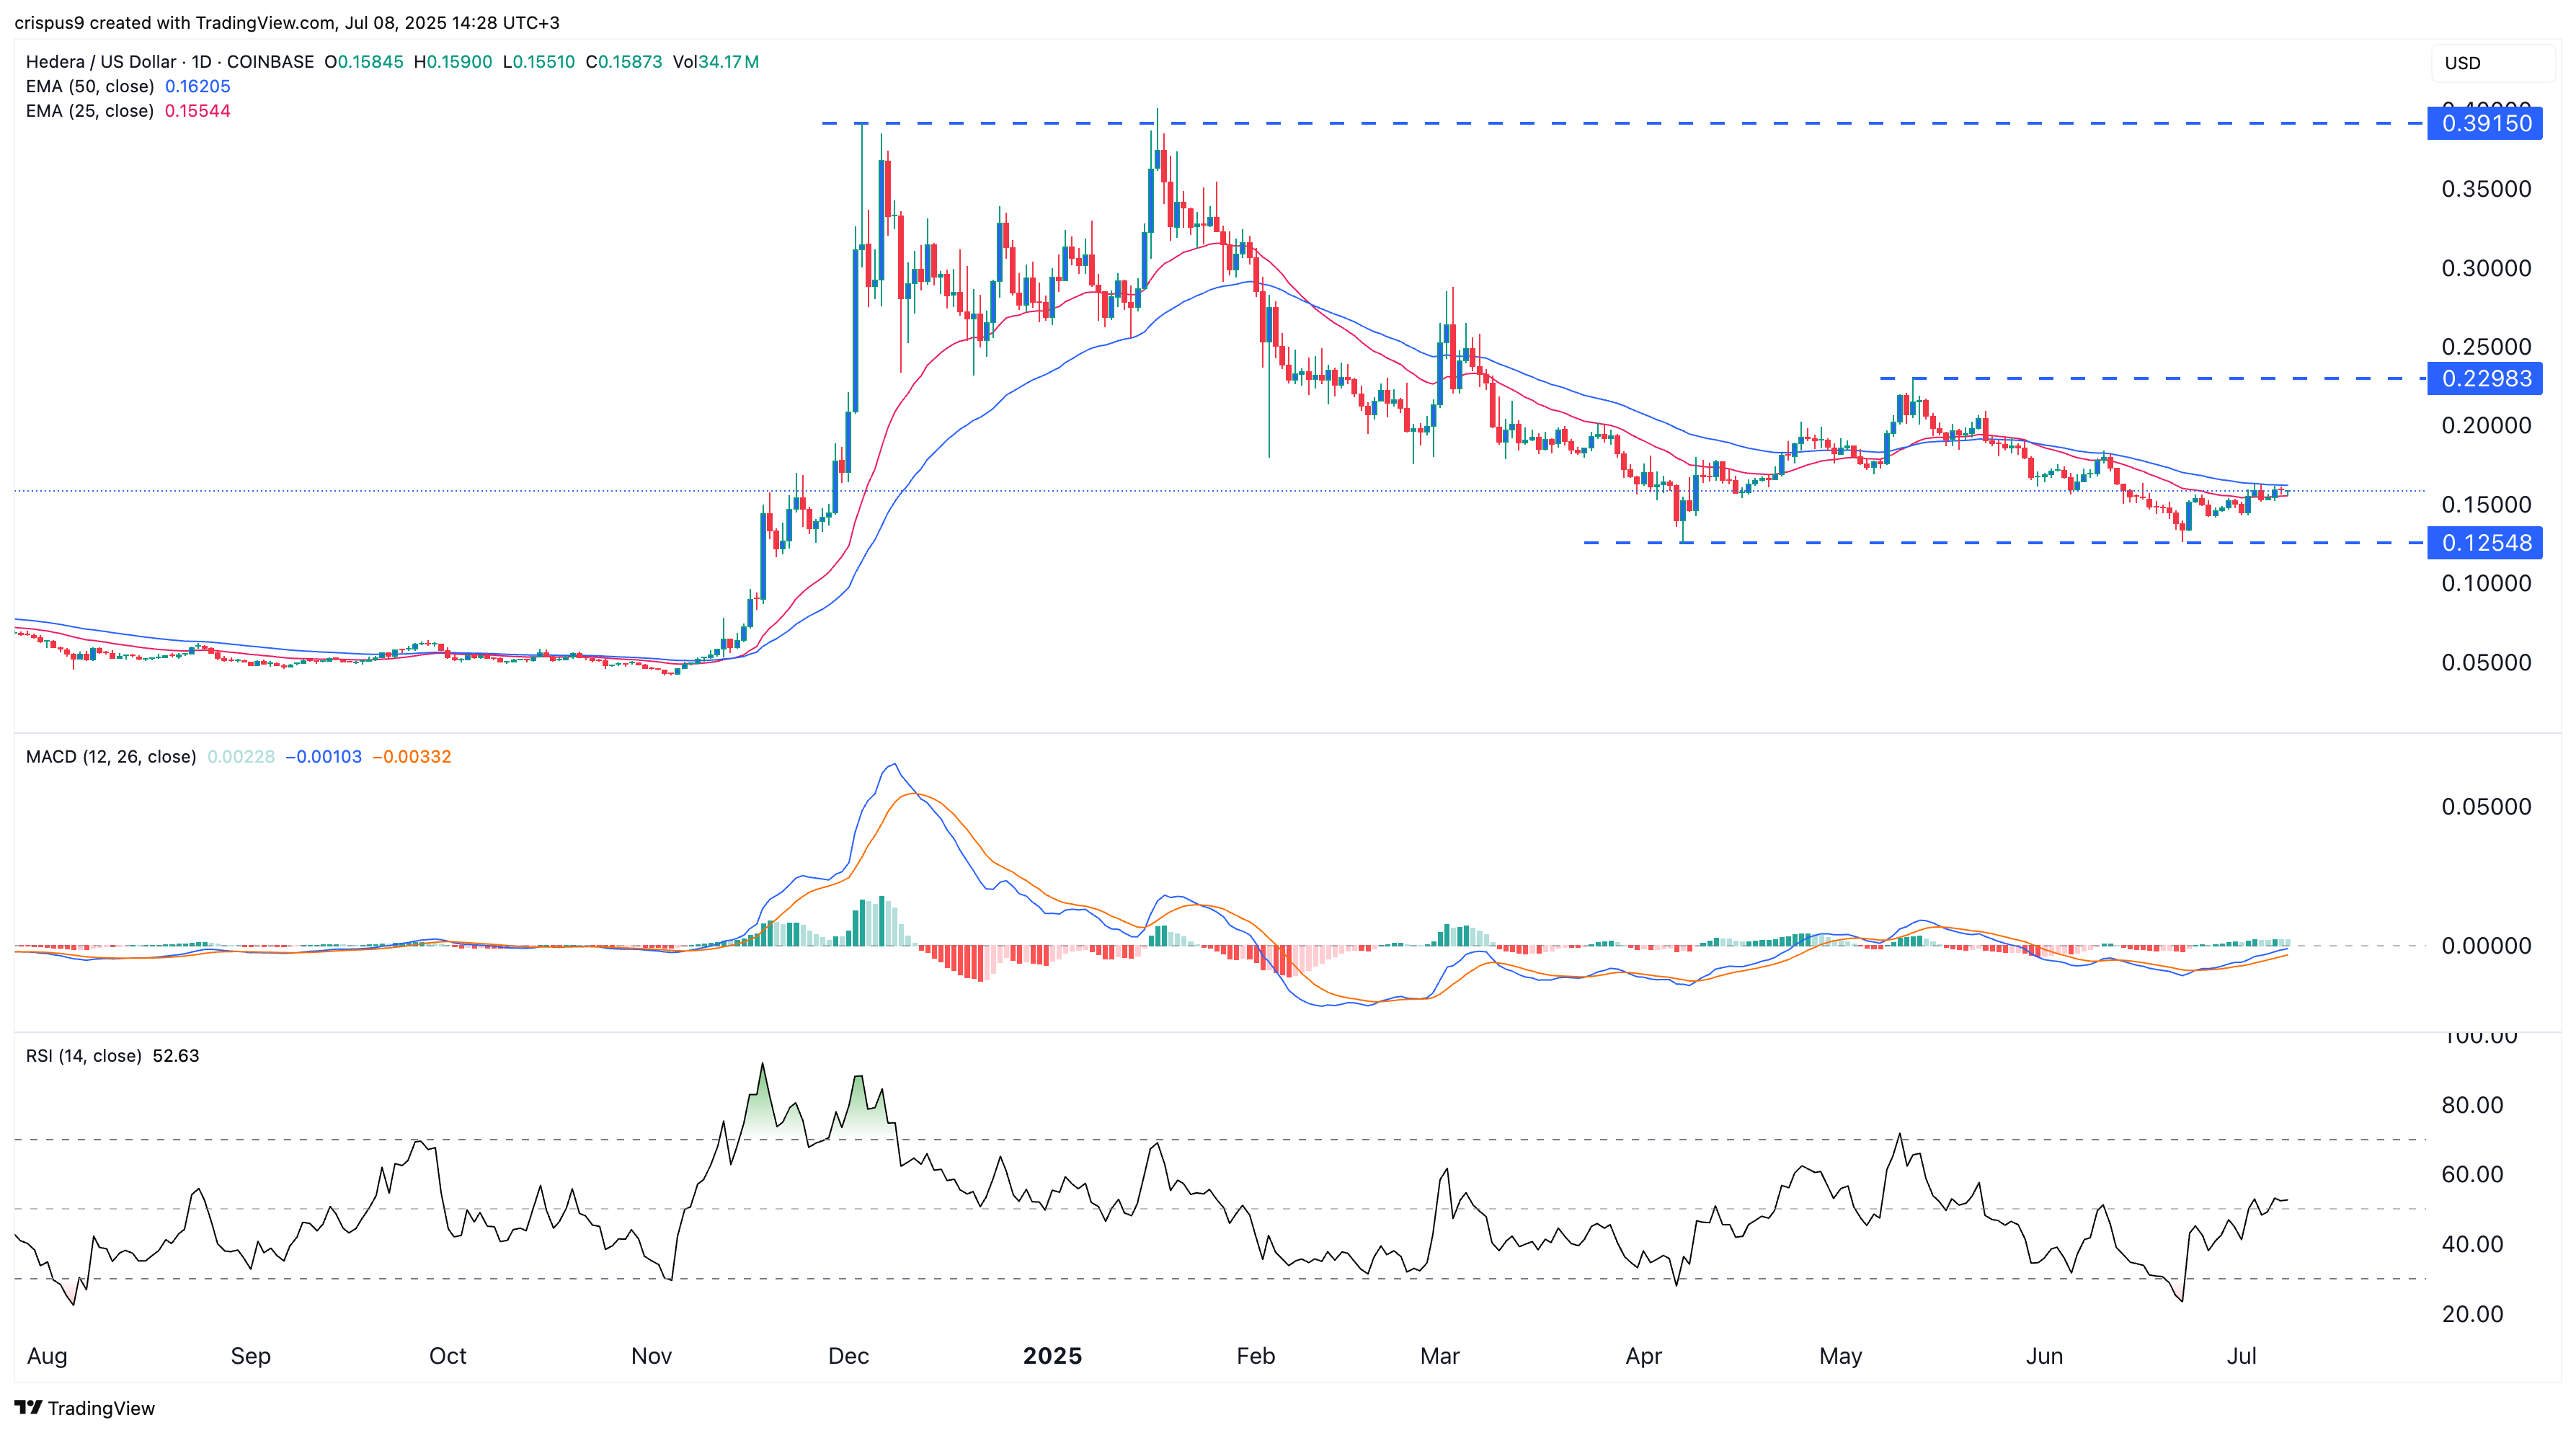
Hedera price chart | Source: crypto.news
Technical indicators suggest that HBAR may be nearing a bullish breakout. The token has formed a double-bottom pattern with support at $0.1254 and a neckline at $0.2298. This pattern is typically associated with strong bullish reversals.
Earlier this year, HBAR fell from $0.3925 in January to a low of $0.1255 in April following the formation of a double-top pattern with a neckline at $0.2300.
The Relative Strength Index has moved from an oversold reading of 30 to above 52 and is trending upward. Meanwhile, the MACD indicator is approaching a crossover above the zero line.
Given these signals, HBAR will likely rebound and potentially retest the neckline at $0.2298, which would represent a 45% gain from current levels. A break above that neckline could open the door for further upside toward $0.30.


