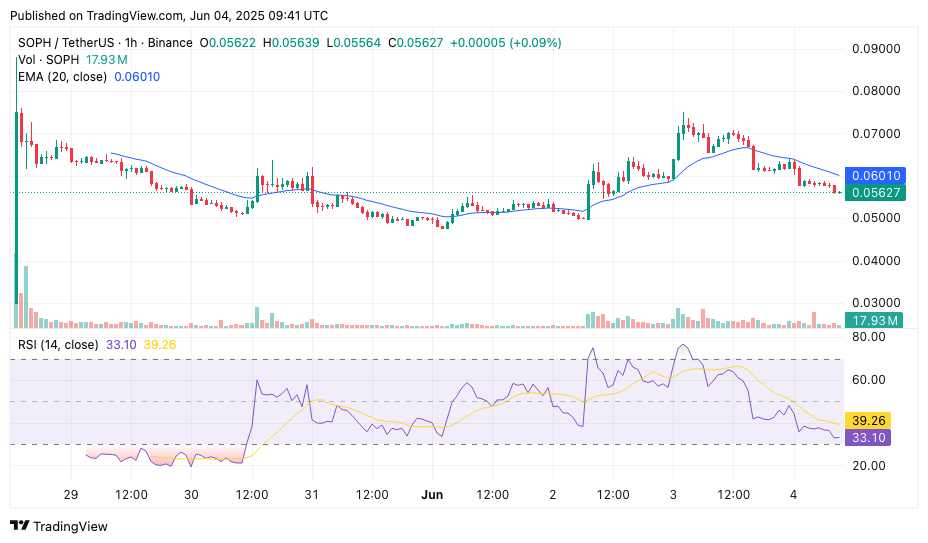
After a strong debut rally to $0.11, SOPH price has retraced nearly 50%, with technicals signaling further downside.
Launched on 28 May, Sophon (SOPH) price rallied hard on the launch day, surging from $0.030 to $0.1108. However, it has since retraced almost 50% from that peak, currently trading at $0.056, with 24-hour volume at $415 million, down 40% in the past 24 hours.
On the 1-hour chart, SOPH price broke below the 20 EMA yesterday and has since lost the previous local support at $0.60, the same area where the token broke out yesterday following the Bithumb listing announcement. It also marks the midpoint of the key 0.5–0.618 Fibonacci retracement zone, adding strong confluence. However, it failed to hold under selling pressure.

With price now at $0.056, it has slipped below the 0.618 Fib level ($0.05788) and is approaching the 0.786 Fib level near $0.053. This level now serves as the most immediate support and potential reversal point. However, without a strong bounce or bullish confirmation candle, the probability of further downside remains high.
Adding to the bearish outlook, momentum has faded sharply, with the RSI falling from overbought levels above 80 to 33, and now trending below its moving average. Volume has also declined considerably, down by over 40% in the past 24 hours.


