

Memecoins SPX6900, Floki, and Fartcoin are all hovering at key technical levels, with recent price action hinting at possible bullish reversals if key resistance zones can be broken in the days ahead.
Crypto markets dropped nearly 2% on July 17, bringing the total market cap down to $3.8 trillion. In contrast, the memecoin sector rallied 5.7% during the same period.
Bitcoin’s (BTC) recent gains after it hit a new all-time high above $123,000 on July 14 seem to have reignited risk-on sentiment across the market.
Although Bitcoin has since corrected to $118,000, where it has remained relatively flat over the past 24 hours as of press time, Ethereum (ETH) has gained 9% during the same period, reaching a seven-month high of $3,450.
Over the past week, Ethereum has gained 23.4%, significantly outpacing Bitcoin’s 6.4% increase. The shift suggests growing investor interest in assets beyond Bitcoin.
Some analysts view this as a sign that Bitcoin dominance is weakening, a recurring trend that has been observed before the start of an altcoin season.
For a sustained altcoin rally to begin analysts say Ethereum must continue to outperform Bitcoin consistently. When capital rotates from Bitcoin into Ethereum, it often moves further down into mid-cap tokens and eventually memecoins, which have historically seen the strongest rallies during such phases.
Among the top performers drawing attention at the moment are SPX, FLOKI, and FARTCOIN — each of these meme coins has formed distinct breakout setups that could pave the way for more upside in the days ahead.
SPX6900
SPX6900 (SPX) has gained 20% over the past week, reaching an intraday high of $1.89 on July 16 before pulling back slightly to $1.81 at the time of writing. The token is now up approximately 524% from its year-to-date low.
The recent rally appears to have been triggered by a breakout from a bull-flag pattern on the daily chart. SPX is currently testing a key resistance level at $1.81, which marks the neckline of a developing cup and handle pattern, a classic bullish formation that often signals the continuation of an uptrend.

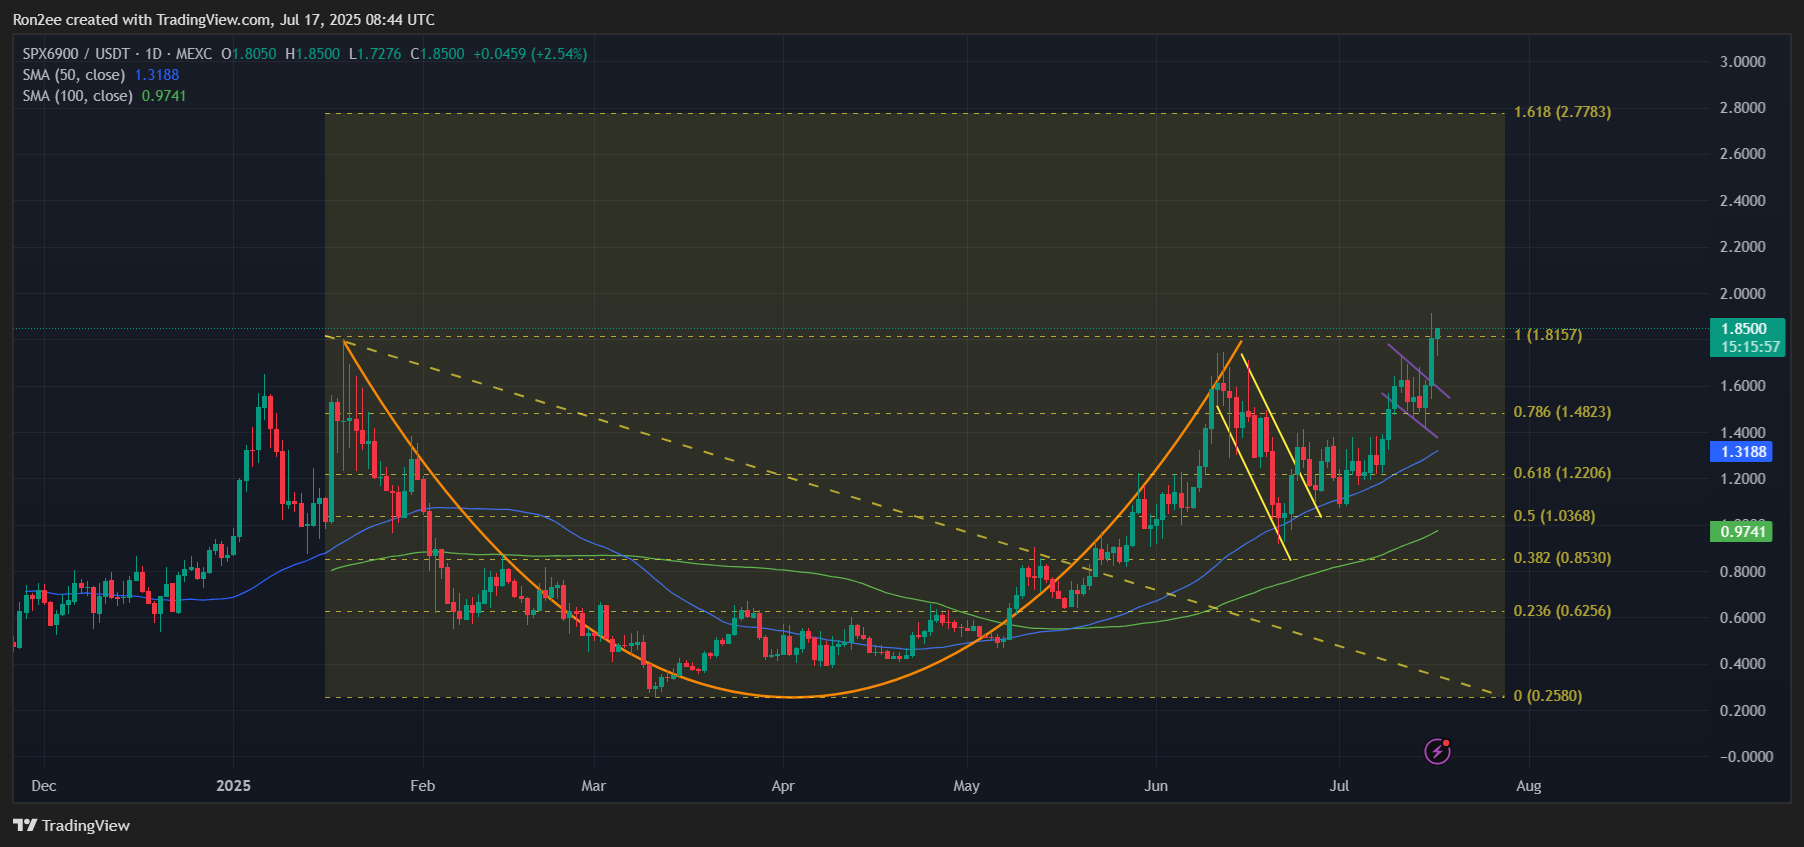
SPX also continues to trade above both its 50-day and 200-day moving averages, a technical signal that generally reflects sustained upward momentum and positive long-term trend alignment.
If SPX breaks above the neckline with strong volume, the next major target lies at $2.77. The level represents a 53% increase from the current price and aligns with the projected breakout range of the cup and handle pattern.
FLOKI
FLOKI (FLOKI) was trading at $0.000132 as of last check Thursday afternoon, Asian time, up 44.5% over the past week, with most of its gains coming in the last 24 hours. As of press time, FLOKI was up 175% from its year-to-date low recorded in April.
The rally appears to have picked up momentum after FLOKI broke out of a long-term descending trendline on the daily chart. The token successfully retested the former resistance, which is now acting as support, a move widely viewed as a bullish breakout and a potential shift in market sentiment.
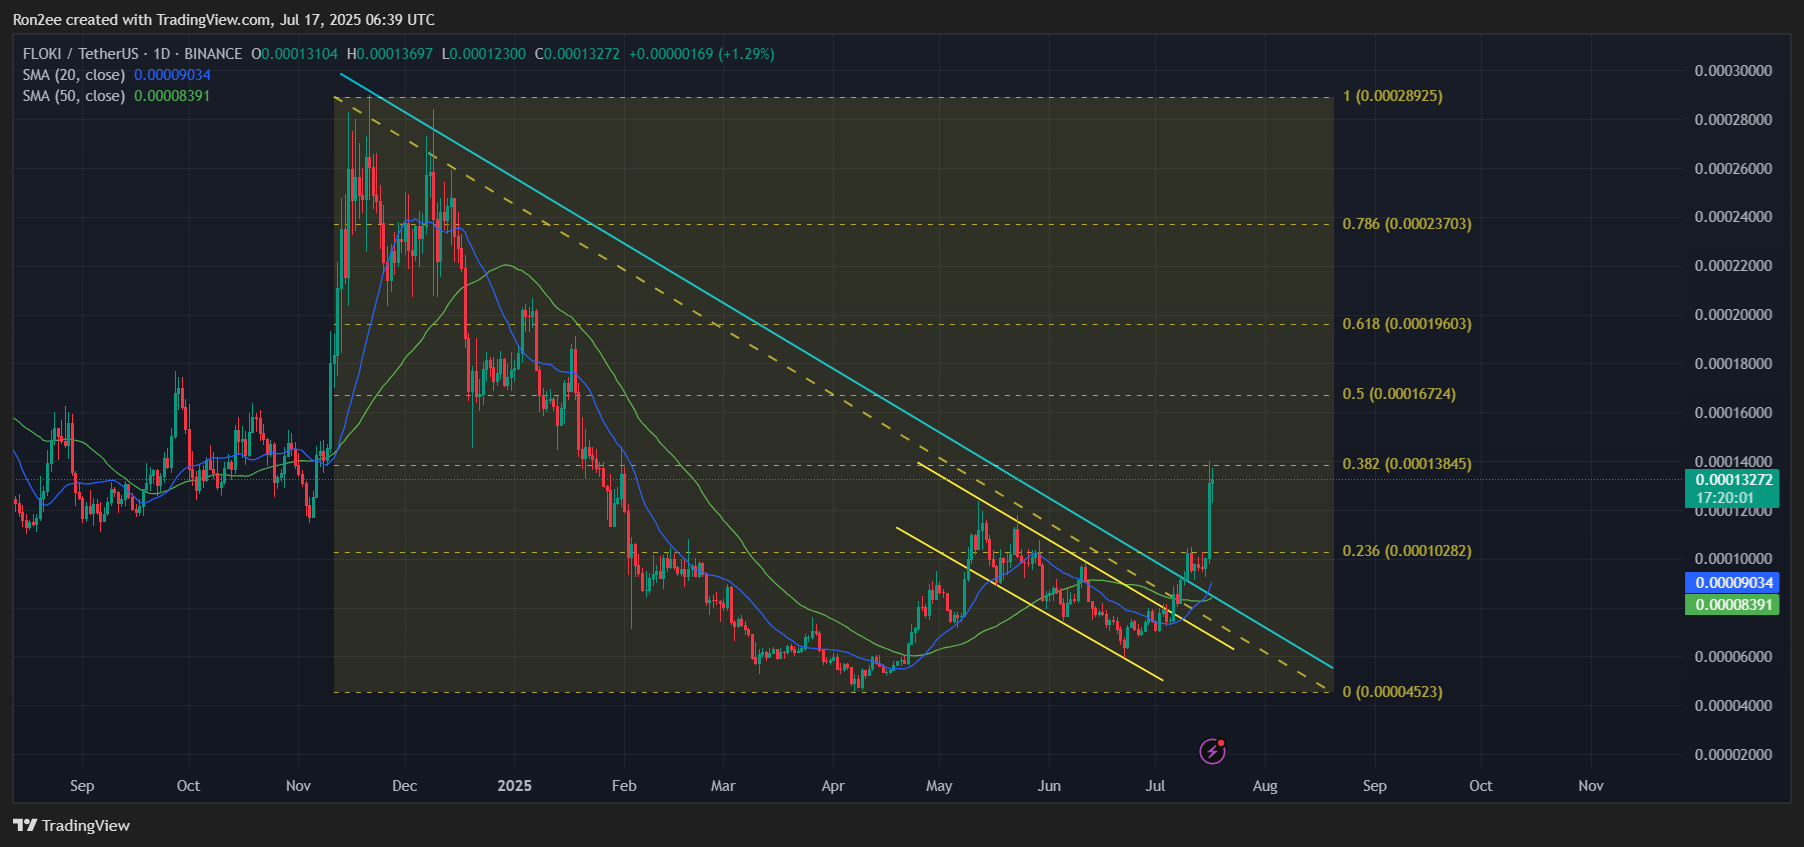
FLOKI also cleared a descending parallel channel that had been in place since May. This breakout adds strength to the current bullish outlook and points to the possibility of further gains in the near term.
However, the token is now facing resistance at the 61.8% Fibonacci retracement level, located at $0.000167. A daily close above this level could push the price toward the 78.6% Fibonacci level at $0.000196, representing an upside of approximately 52% from the current price.
On-chain data supports the upside theory. According to analytics firm Nansen, the number of daily active addresses has more than doubled today, signaling increased network activity and user engagement.
Market sentiment has also been boosted by speculation around a possible Robinhood listing, which has been circulating on X lately.
FARTCOIN
Over the past seven days, Fartcoin (FARTCOIN) has gained 21.3%, trading at $1.44 at the time of writing. Its market capitalization now stands at approximately $1.43 billion. The recent rally has pushed its year-to-date gains to over 550%.
FARTCOIN is currently testing the upper boundary of an ascending channel that began forming after the token dropped to a low of $0.80 in June. This level has now become a key resistance zone.

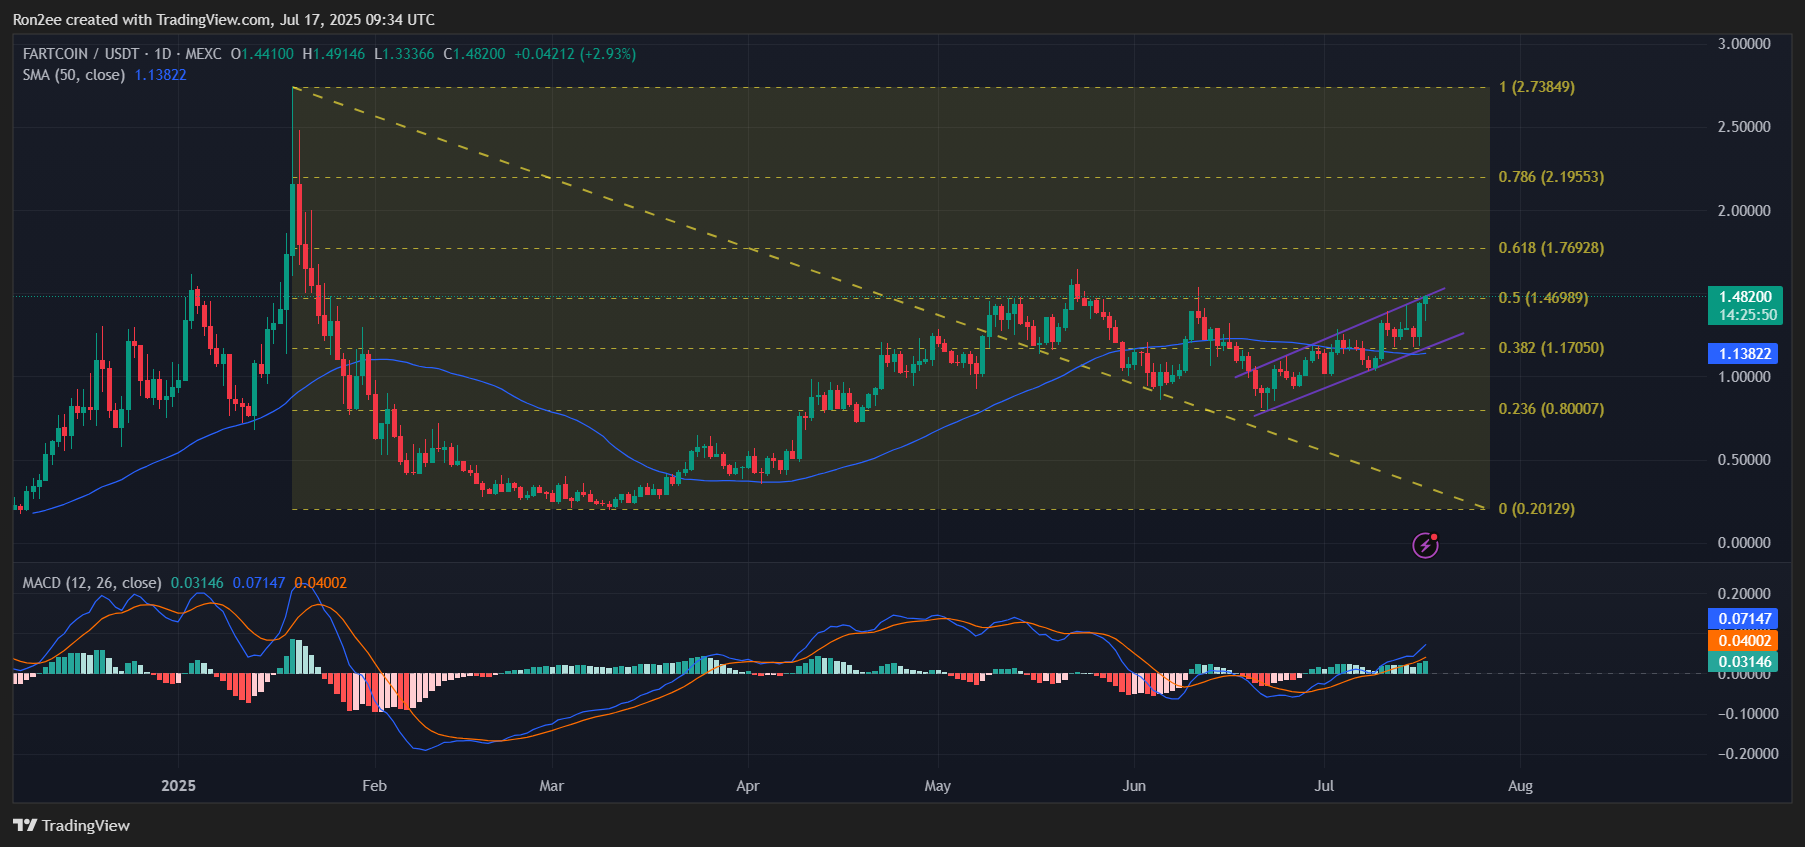
The token continues to trade above its 50-day moving average, a sign that the broader trend remains bullish. Momentum indicators like the MACD lines are trending upward, indicating that momentum is still in favor of the bulls.
If buying pressure holds, a breakout above the immediate resistance at $1.46, aligned with the 50% Fibonacci retracement level, could trigger the next leg up. The next major target lies at $2.7, its year-to-date high and stands 87% above the current price.
Disclosure: This article does not represent investment advice. The content and materials featured on this page are for educational purposes only.