
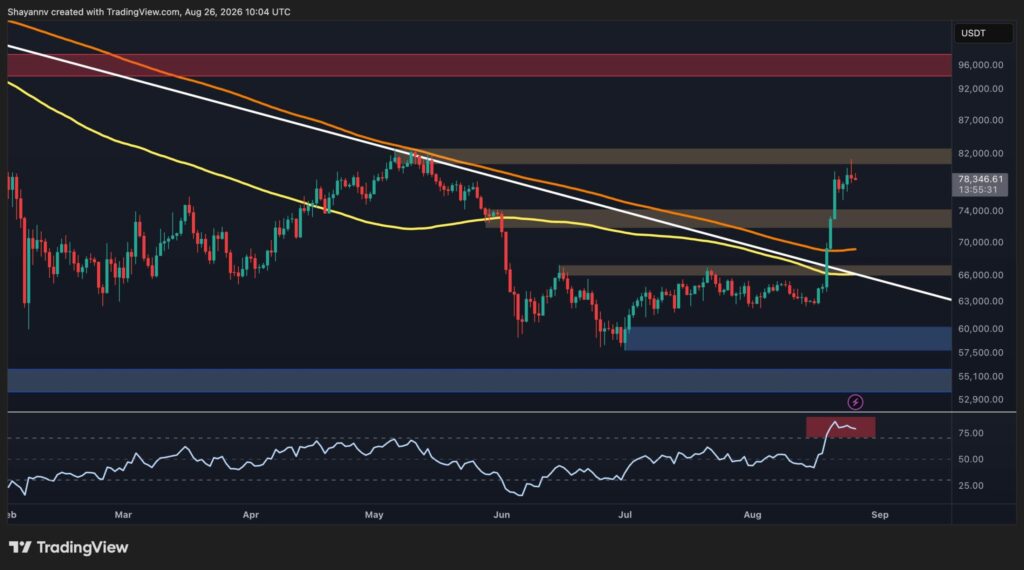
Bitcoin has staged a sharp recovery from the $60K demand zone, breaking above several major technical barriers and reclaiming the $72K-$74K area. The latest move has pushed BTC toward the $80K resistance zone, where momentum is beginning to show signs of exhaustion. At the same time, the on-chain picture has improved materially, with the average market participant taking profits again.
Bitcoin Price Analysis: The Daily Chart
The daily chart shows a significant structural improvement. BTC spent several months consolidating below a descending trendline, with the $60K-$67K area acting as the main range. The breakout above the trendline and the $67K resistance zone was followed by an aggressive move higher, first through $72K-$74K and then toward the current $80K area.
Bitcoin is also now trading above the 100-day (~$66K) and 200-day (~$70K) moving averages shown on the chart, which have also started to flatten or turn higher. This suggests that the broader structure has shifted from consolidation toward a more constructive trend. The previous resistance around $72K-$74K could therefore become the first major support zone if the market enters a pullback.
However, the $80K-$82K region is an important obstacle. It corresponds to the upper resistance zone visible on the chart and is close to the recent local highs. A decisive daily breakout above this area would strengthen the bullish structure and could open the door toward the next major resistance around $95K.
Momentum is the main near-term concern. The daily RSI has surged into the overbought region following the vertical rally. This does not necessarily signal an imminent reversal, as strong trends can remain overbought for extended periods, but it does suggest that BTC may need to consolidate or retrace before attempting another sustained leg higher.
BTC/USDT 4-Hour Chart
The 4-hour chart provides a clearer picture of the recent breakout. BTC spent most of July and August inside a broad contracting structure, bounded by a descending upper trendline and a gradually rising lower boundary. The eventual breakout around $66K was decisive, producing a near-vertical advance through the $72K-$74K resistance zone.
After reaching $80K, Bitcoin has started to consolidate below the latest high. The price is currently around $78K, while the RSI has pulled back substantially from its previous peak. There is also a visible bearish divergence, with the price making a higher high while the RSI forms a lower high. This suggests that short-term momentum is weakening even though the broader breakout structure remains bullish.
The immediate resistance is therefore the $80K zone. A clean 4-hour close above it, followed by a successful retest, would provide stronger confirmation that the breakout is continuing rather than simply producing a local relief rally.
On the downside, $72K-$74K is the key near-term support. Holding above this zone would keep the breakout structure intact. If BTC loses it, the next important area is around $64K, which was the original consolidation zone and should now act as a major test of whether the overall trend reversal is genuine.

On-Chain Analysis
The adjusted SOPR chart provides an encouraging confirmation of the recent price recovery. Adjusted SOPR measures whether spent Bitcoin is, on average, being realized at a profit or a loss. The 1.0 level is particularly important: readings above 1 indicate that coins are generally being spent at a profit, while readings below 1 indicate that losses dominate.
The metric spent a prolonged period below 1 during Bitcoin’s previous correction, reflecting persistent loss realization. More recently, aSOPR has rebounded sharply, and its 30-day EMA has also turned higher and moved above the 1.0 threshold.
This is an important improvement because it suggests that profitable spending has returned alongside the price recovery. Historically, a sustained move above 1 can support a transition toward a healthier bullish market structure, particularly when the metric’s trend is also rising.
That said, the latest jump is quite steep, meaning some short-term cooling would not necessarily invalidate the broader signal. If aSOPR remains above 1 during any BTC pullback, it would suggest that holders are still realizing profits rather than capitulating. Conversely, a return below 1 would weaken the bullish interpretation and could indicate that the recent recovery is losing underlying strength.

The post Bitcoin Price Analysis: Is BTC’s Rally in Trouble After Failing to Reclaim $80K? appeared first on CryptoPotato.