

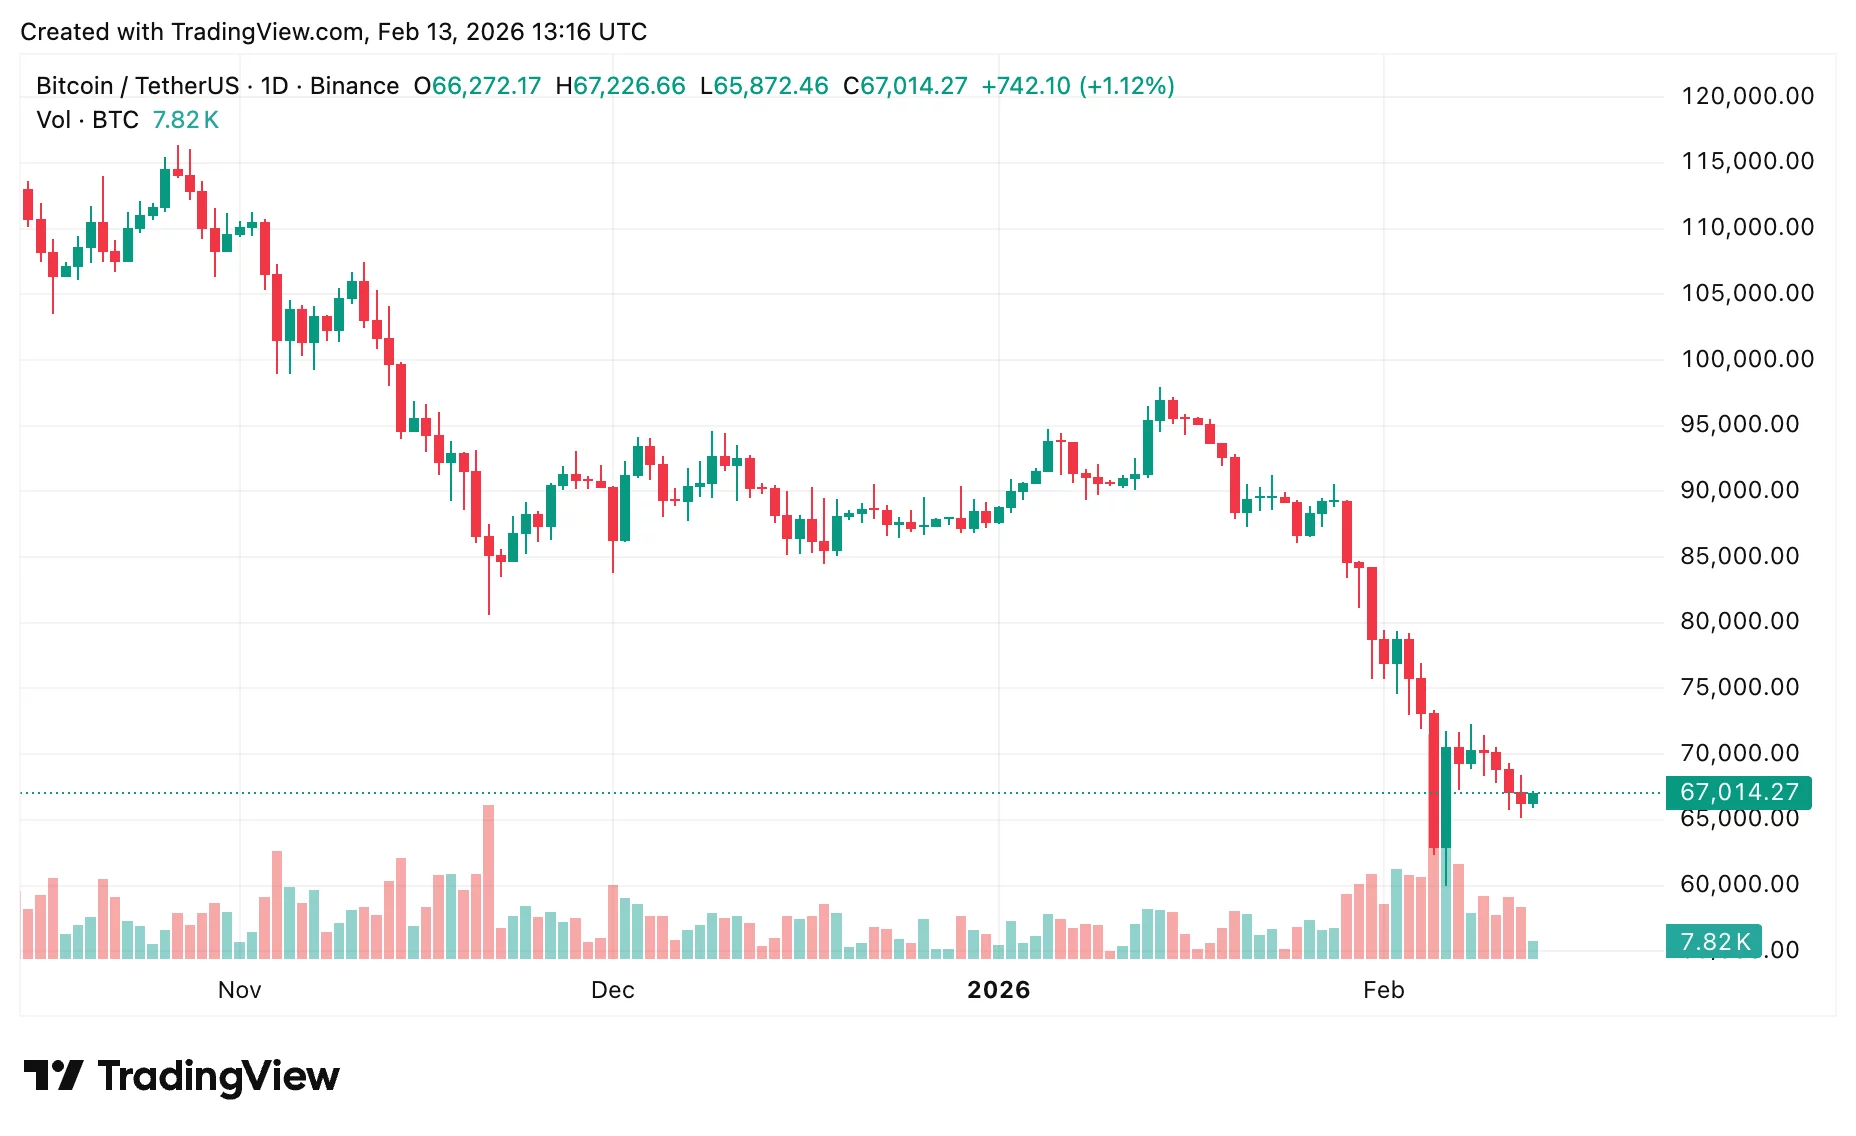
After dipping to $65,092 yesterday, Bitcoin has found some stability and is currently trading near $69,000 as of February 13. The asset is up about 4.3% at last check, clinging to about a 1% gain on the week.
However, the broader monthly trend remains under pressure, with BTC down close to 29%.
At the moment, the market seems to be in a wait-and-see mode. Buyers are defending key support areas, while sellers remain active near resistance. With neither side in full control, the Bitcoin price continues to move within a clearly defined range, awaiting a stronger catalyst for direction.
Summary
- Bitcoin has stabilized near $67,000 after dipping to $65,092, with the monthly trend still down about 29%.
- The market is range-bound between $60,000 and $70,000, indicating sideways consolidation.
- Short-term outlook remains neutral, with sellers controlling lower highs.
Current market scenario
A zone between $60,000 and $70,000 aligns with the midpoint of a descending channel, which helps explain why sellers stepped back in.
At this point, Bitcoin (BTC) doesn’t appear ready to restart a powerful bullish move. Instead, the market is trading sideways within a defined range:
- $60,000 — strong static support and a proven demand region
- $70,000 — key resistance aligned with the channel’s dynamic mid-boundary
Until one of these levels is decisively broken, the Bitcoin price is likely to remain range-bound. Consolidation phases often precede powerful directional moves, but patience is required while the market builds momentum.
Technical outlook: What the structure tells us
The current structure favors neutrality in the short term. Price action shows lower highs within the descending channel, indicating that sellers still hold short-term control. However, the repeated defense of the $60,000 region shows that long-term participants remain interested in accumulation at lower levels.
A decisive daily close above $70,000 would signal a break from the immediate bearish pattern and could restore confidence in a bullish continuation. Without that confirmation, rallies may continue to stall.
From a macro perspective, the recent decline appears more like a reset than a reversal. Corrections of 20–30% have frequently occurred during broader uptrends, so the latest move doesn’t necessarily compromise the overall Bitcoin forecast.
Upside potential
Breaking above $70,000 could spark a stronger bullish move toward $74,000–$75,000. That area, previously supported, may now act as resistance and serve as the next meaningful target.
If Bitcoin can hold above $75,000, the broader Bitcoin price prediction would favor trend continuation over range-bound action.
Downside risks
In the near term, $66,000 is an important level to watch. Falling below it could push Bitcoin toward $64,000 fairly quickly.
If selling intensifies, attention turns to $60,000 — a major support that has historically held strong. Long-term investors may see this as a value entry.
However, a confirmed drop below $60,000 would seriously weaken the chart and could shift the broader BTC outlook toward a deeper correction.
Bitcoin price prediction based on current levels
At present, the most realistic scenario is continued consolidation between $60,000 and $70,000. The market is compressing within this range, building energy for a larger move.
Bullish scenario: Sustained move above $70,000 → upside toward $74,000–$75,000.
Bearish scenario: Breakdown below $66,000 → decline to $64,000, with $60,000 as critical support.
In conclusion, the Bitcoin forecast highlights a market at a crossroads. Sideways action may continue in the near term, but once price moves out of the $60,000–$70,000 range, the next directional trend in Bitcoin could unfold quickly.