

FTT price jumped more than 30% after a surprise “gm” post on Sam Bankman-Fried’s X account sparked a wave of speculative trading.
Summary
- A “gm” post from SBF’s X account sent FTT up ~30% intraday on Sept. 23–24.
- Derivatives volume and open interest jumped sharply, raising liquidation risk.
- Daily chart shows momentum but longer-term averages and oscillators advise caution.
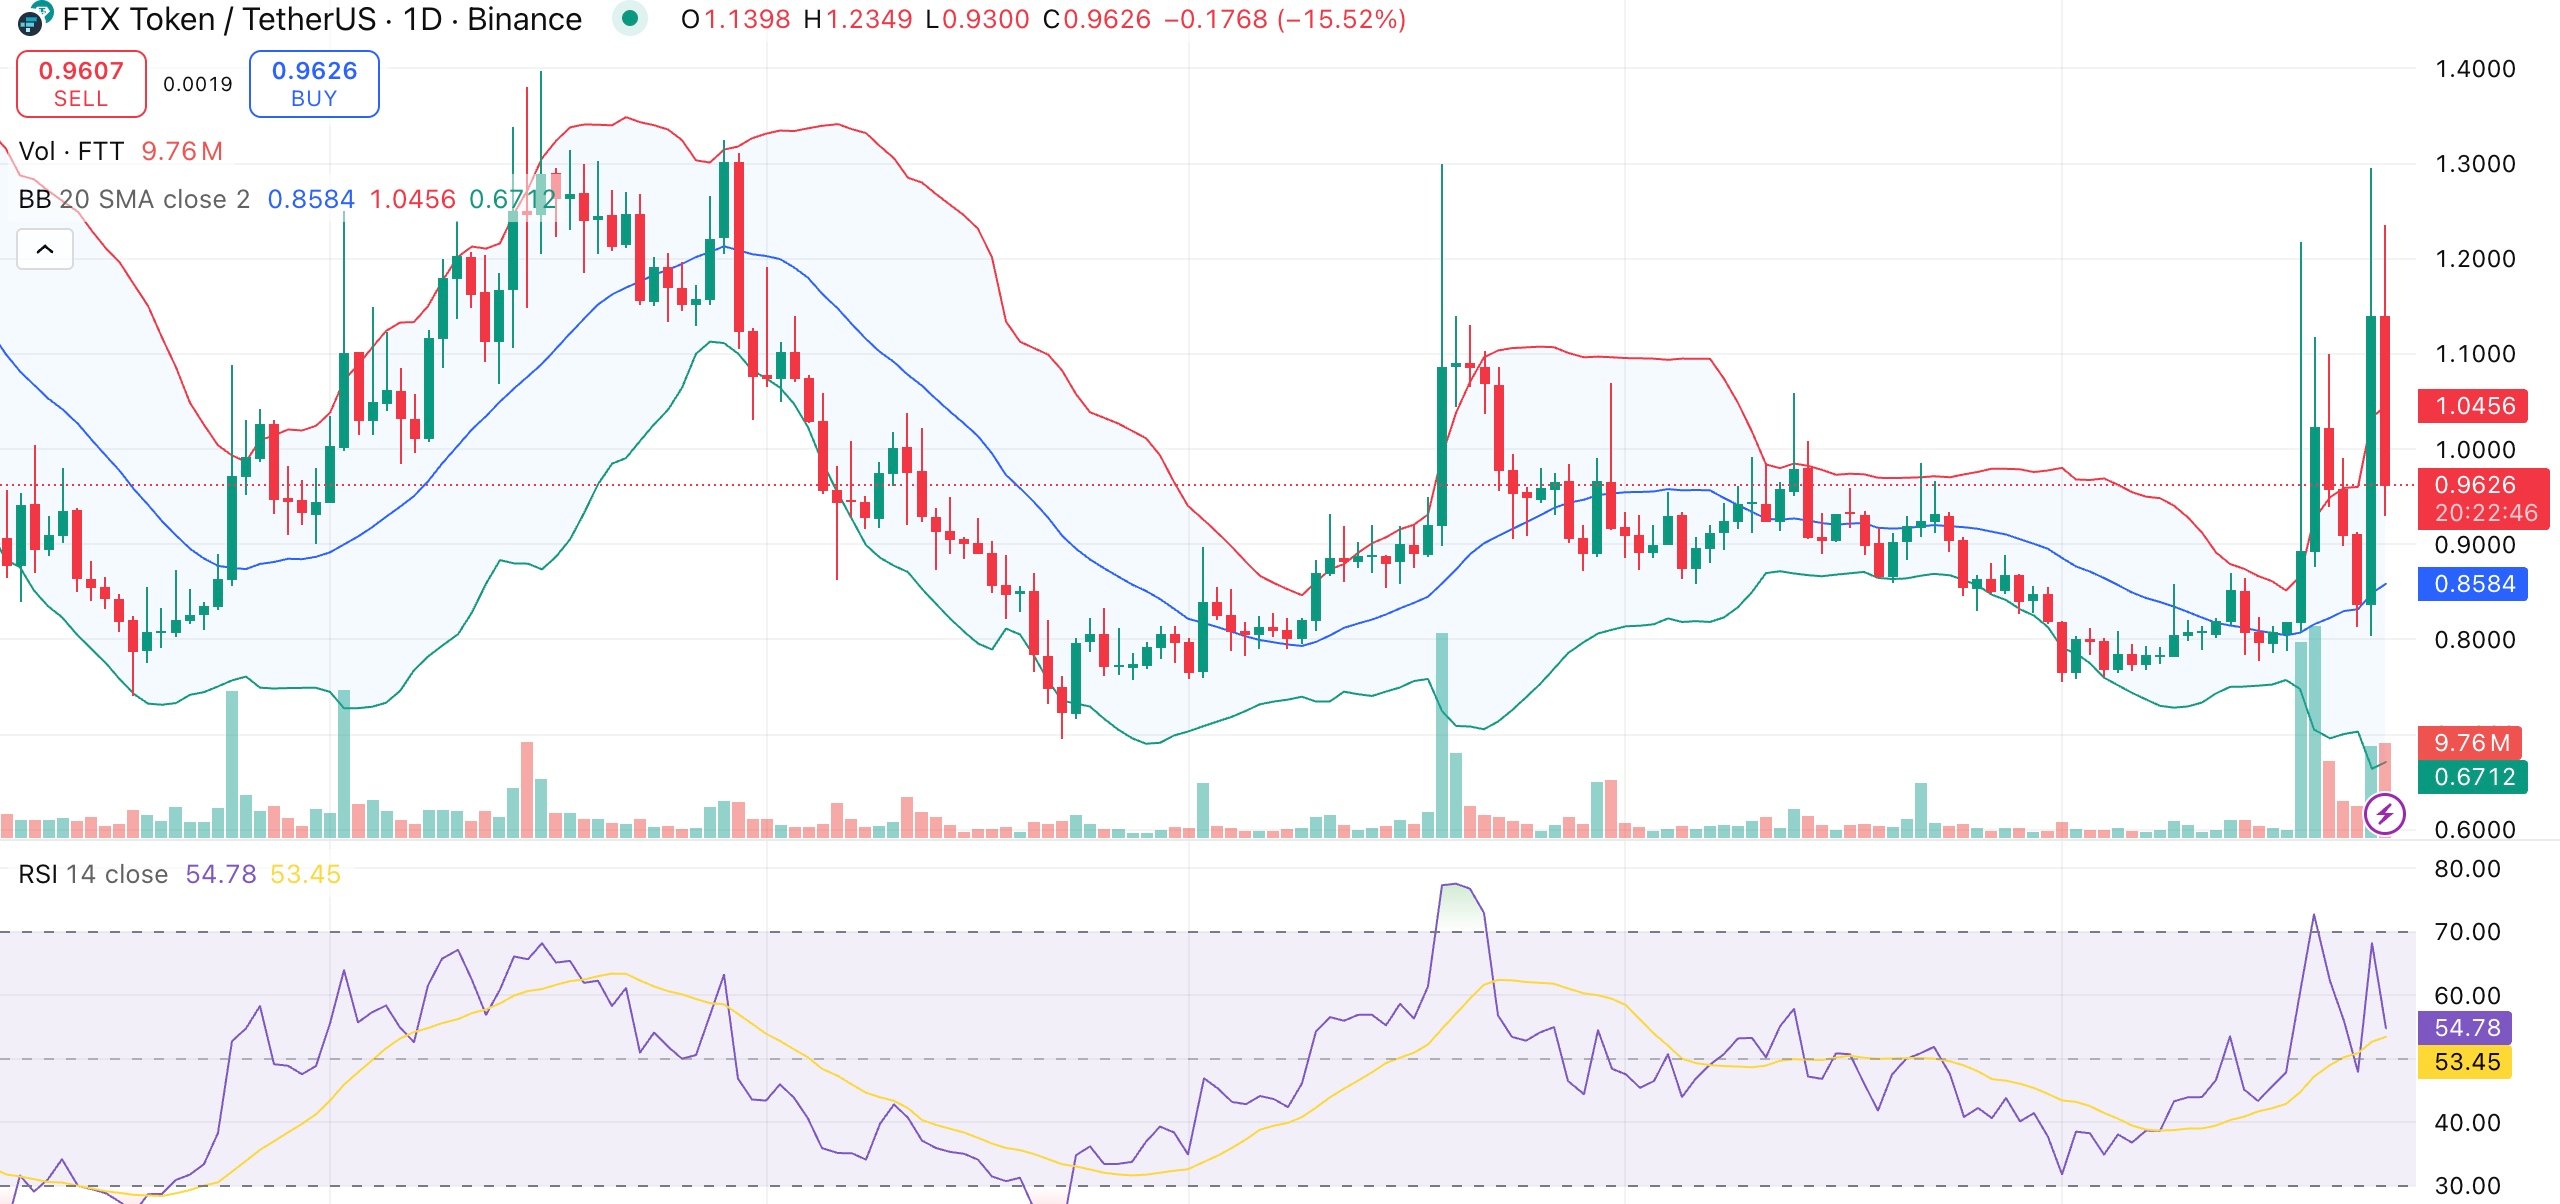
On Sept. 23–24, FTT staged a sharp, headline-grabbing move. The token climbed to an intraday high near $1.20, up roughly 30% from prior levels, then settled around $0.97 as of press time as traders took profits and the initial frenzy faded.
FTT is still up about 22% on the day. Weekly gains now stand at 20%, while the token has risen 7.9% in the past month. Despite this jump, FTT remains 99% below its all-time high of $84.19 from 2021.
The latest surge was accompanied by a sharp rise in trading volume. FTT saw a 281% increase in 24-hour spot volume to $49.6 million. According to Coinglass data, derivatives activity also increased, with open interest rising 38% to $3.3 million and volume jumping 1,353% to $30.3 million.
These numbers suggest a rise in leveraged speculation, which increases the likelihood of significant fluctuations in either direction.
Social signal drives sharp reaction
The catalyst was a short “gm” message posted from SBF’s account on Sept. 23, marking the first notable activity in months. The post was enough to spark heavy speculation, even though a friend later clarified that they were the ones who created the post and not SBF.
Traders quickly moved into FTT, echoing similar market reactions to prior activity on the account earlier this year.
Community response ranged from memes about “pumping from prison” to skepticism about the token’s value, given FTT’s lack of utility after the collapse of the FTX exchange. The latest episode reinforces how attention around SBF’s account can still generate volatility, even without fundamental backing.
FTT price technical analysis
The technical picture shows short-term strength despite overall mixed signals. On the daily chart, FTT overextended, briefly rising above the upper Bollinger Band at $1.05 before falling back. After cooling from overbought levels during the spike, the relative strength index is currently in neutral territory at 54.7.

Moving averages point to potential short-term support. A short-term bullish bias is confirmed by the 10-, 20-, and 50-day EMAs all sitting below the current price. This structure is also supported by the 100-day EMA at $0.92. FTT is still in a longer-term downward trend though, as the 200-day EMA at $1.10 is still above the current price.
Momentum indicators are split. The momentum oscillator and commodity channel index are bearish, indicating short-term exhaustion, while the MACD displays a buy signal.
The immediate resistance, if the rally picks up steam, is between $1.05 and $1.20. Support on the downside can be found at $0.90 and $0.80, and a deeper correction could result in a retest of $0.70.