

Gold continued its selling pressure in the first half of the previous week and shifted to buy aggressively in the remainder of the week. The weekly close over the $3357 mark was bullish, and this week we can look for some retracement and buys on gold.
The bias in gold for this week is buy, but it can change mid-week to buy as well. With that in mind, let’s discuss the key pivot levels for gold buying and selling in this XAUUSD weekly forecast from July 14th to July 18th, 2025.
Key economic events of this week
Some significant U.S. economic reports are scheduled for release this week that are expected to impact XAUUSD.
Tue, Jul 15 – Core CPI m/m, CPI m/m, CPI y/y
Persistent inflation pressure was shown by all inflation statistics coming in hotter than anticipated. As a result, the USD gains strength and gold prices may remain high for an extended period of time.
Wed, Jul 16 – Core PPI m/m, PPI m/m
The story of high inflation was further supported by producer inflation, which also surpassed projections. Given the potential persistence of the Fed’s tightening stance, this might further strengthen the currency and put pressure on gold prices.
Thu, Jul 17 – Core Retail Sales m/m, Retail Sales m/m, Unemployment Claims
Retail sales that are higher than anticipated indicate strong consumer demand, which lowers recession fears and strengthens the USD, which is good news for gold.
However, a large increase in unemployment claims might somewhat counteract the strength of the dollar and provide gold with some short-term support.
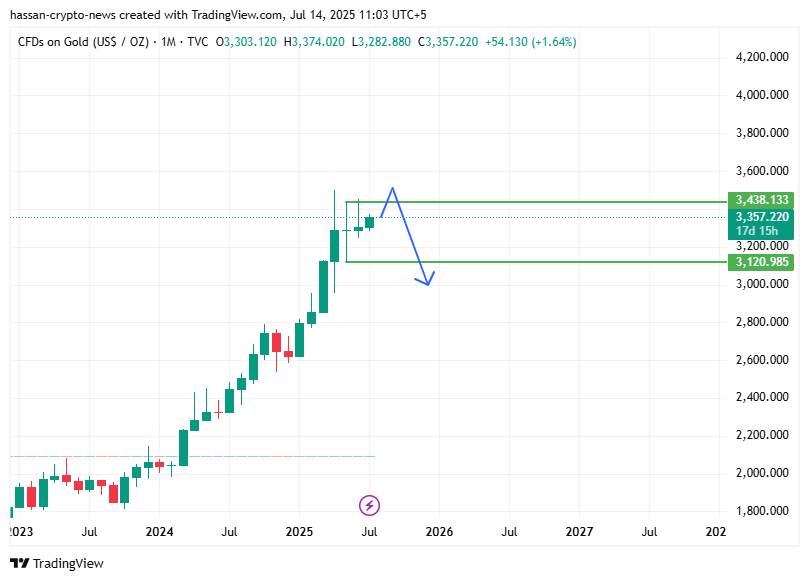
Gold HTF Overview
Despite a couple of monthly candles closing in rejection from above, gold closed them all in green, and for now it seems that gold is all set to make a new all-time high before showing any signs of major retracement towards the range low of $3120 and below.

Gold Forecast for July 14th to July 18th, 2025
On the 4h chart, the golden fib zone is aligning with the order block and POC area of gold. This makes 3331-3311 a great zone to buy gold.
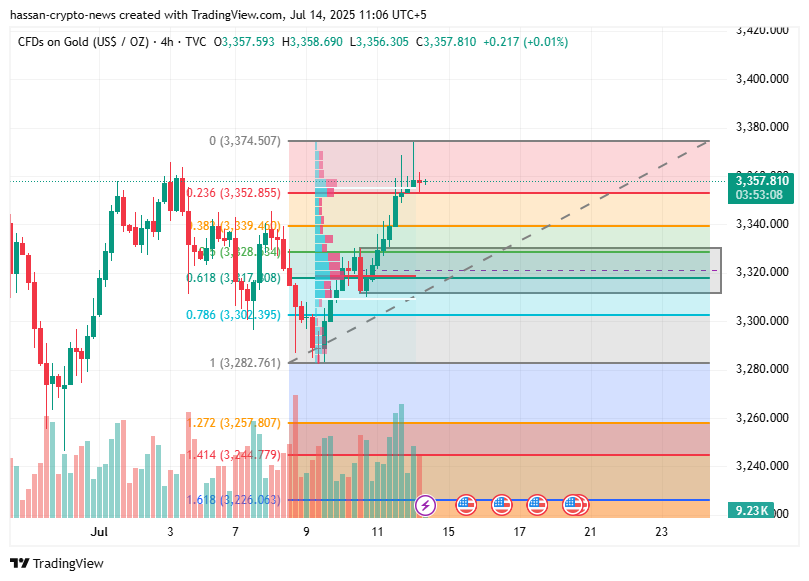
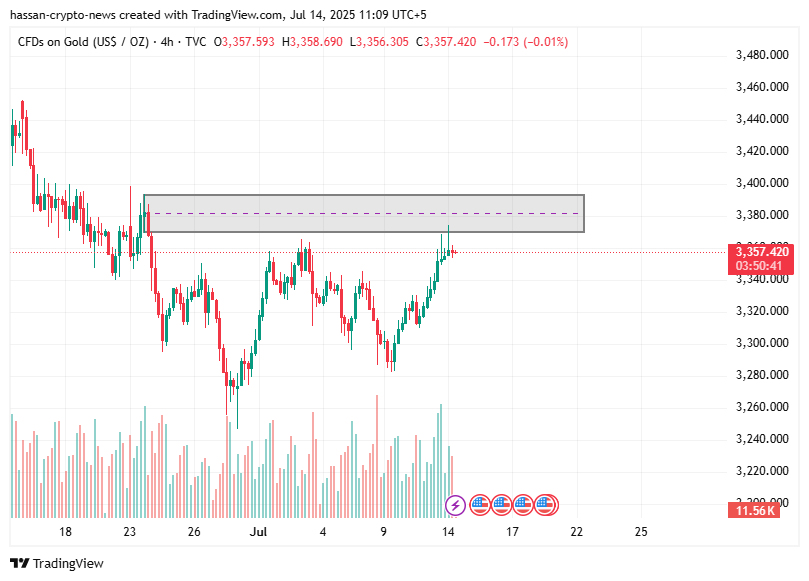
Gold sell area in the 4h chart is starting from $3370 all the way to $3393. It has already been tapped at Monday’s open today; however, we can expect the price to go there again and give rejection again.
Trading Strategies & Investment Recommendation
To conclude, gold can give both buys and sells this week. Lower time frames are suggesting sells, while higher time frames are still favoring a buy position in gold.
Resistance Levels
- $3370-3393 – 4h supply area
Support Levels
- $3331-3311 – 4h POC, golden fib area, order block
- $3204 – weekly level
Disclosure: This article does not represent investment advice. The content and materials featured on this page are for educational purposes only.