After a steep 70% drop from its May peak, Pi Network price is showing early signs of recovery, with a bullish RSI divergence suggesting a potential trend reversal.
After the sharp crash from its May peak of $1.67, Pi Network (PI) price has been gradually bleeding lower, caught in a persistent downtrend marked by lower highs and lower lows. The token has lost over 70% of its value in the past two months, recently stabilizing around the $0.45 level.
However, PI price is now showing early signs of a potential trend shift after printing a bullish RSI divergence on the daily chart. Despite the price action having made fresh lows in late June and early July, the RSI has begun printing higher lows, signaling waning bearish momentum. This classic divergence setup often precedes trend reversals or short-term relief rallies.

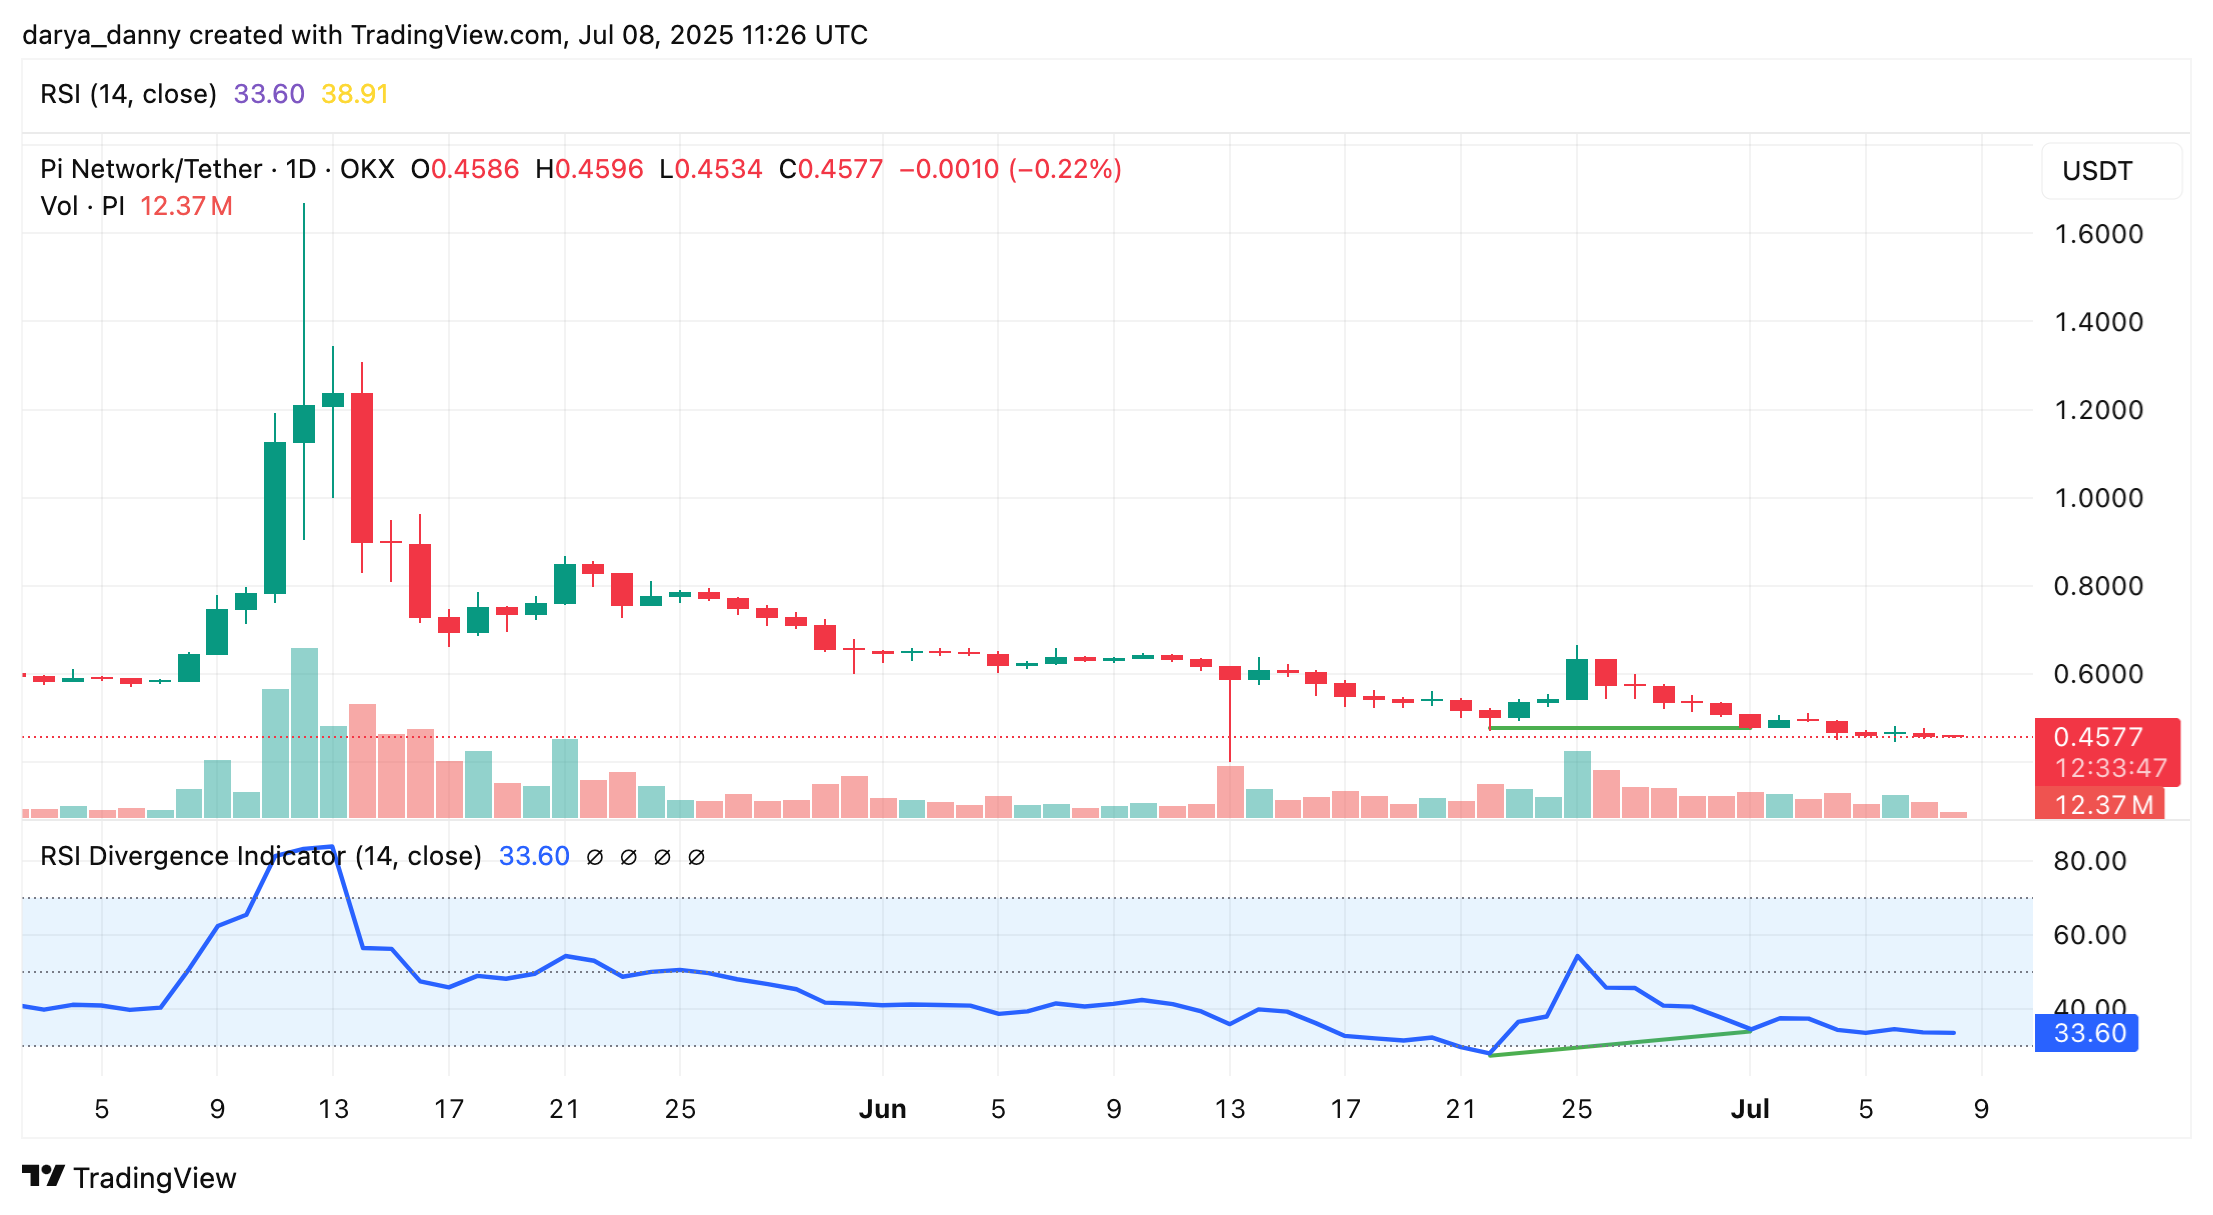
Currently trading around $0.4575, PI price is hovering around new support level around $0.45 established after the recent breakdown from the $0.50–$0.52 zone. If the divergence plays out, this zone is the immediate resistance level to watch, where trapped longs from the previous breakdown may create selling pressure. If bullish momentum picks up, PI price could target a relief rally towards $0.65, aligning with the spike on June 25.
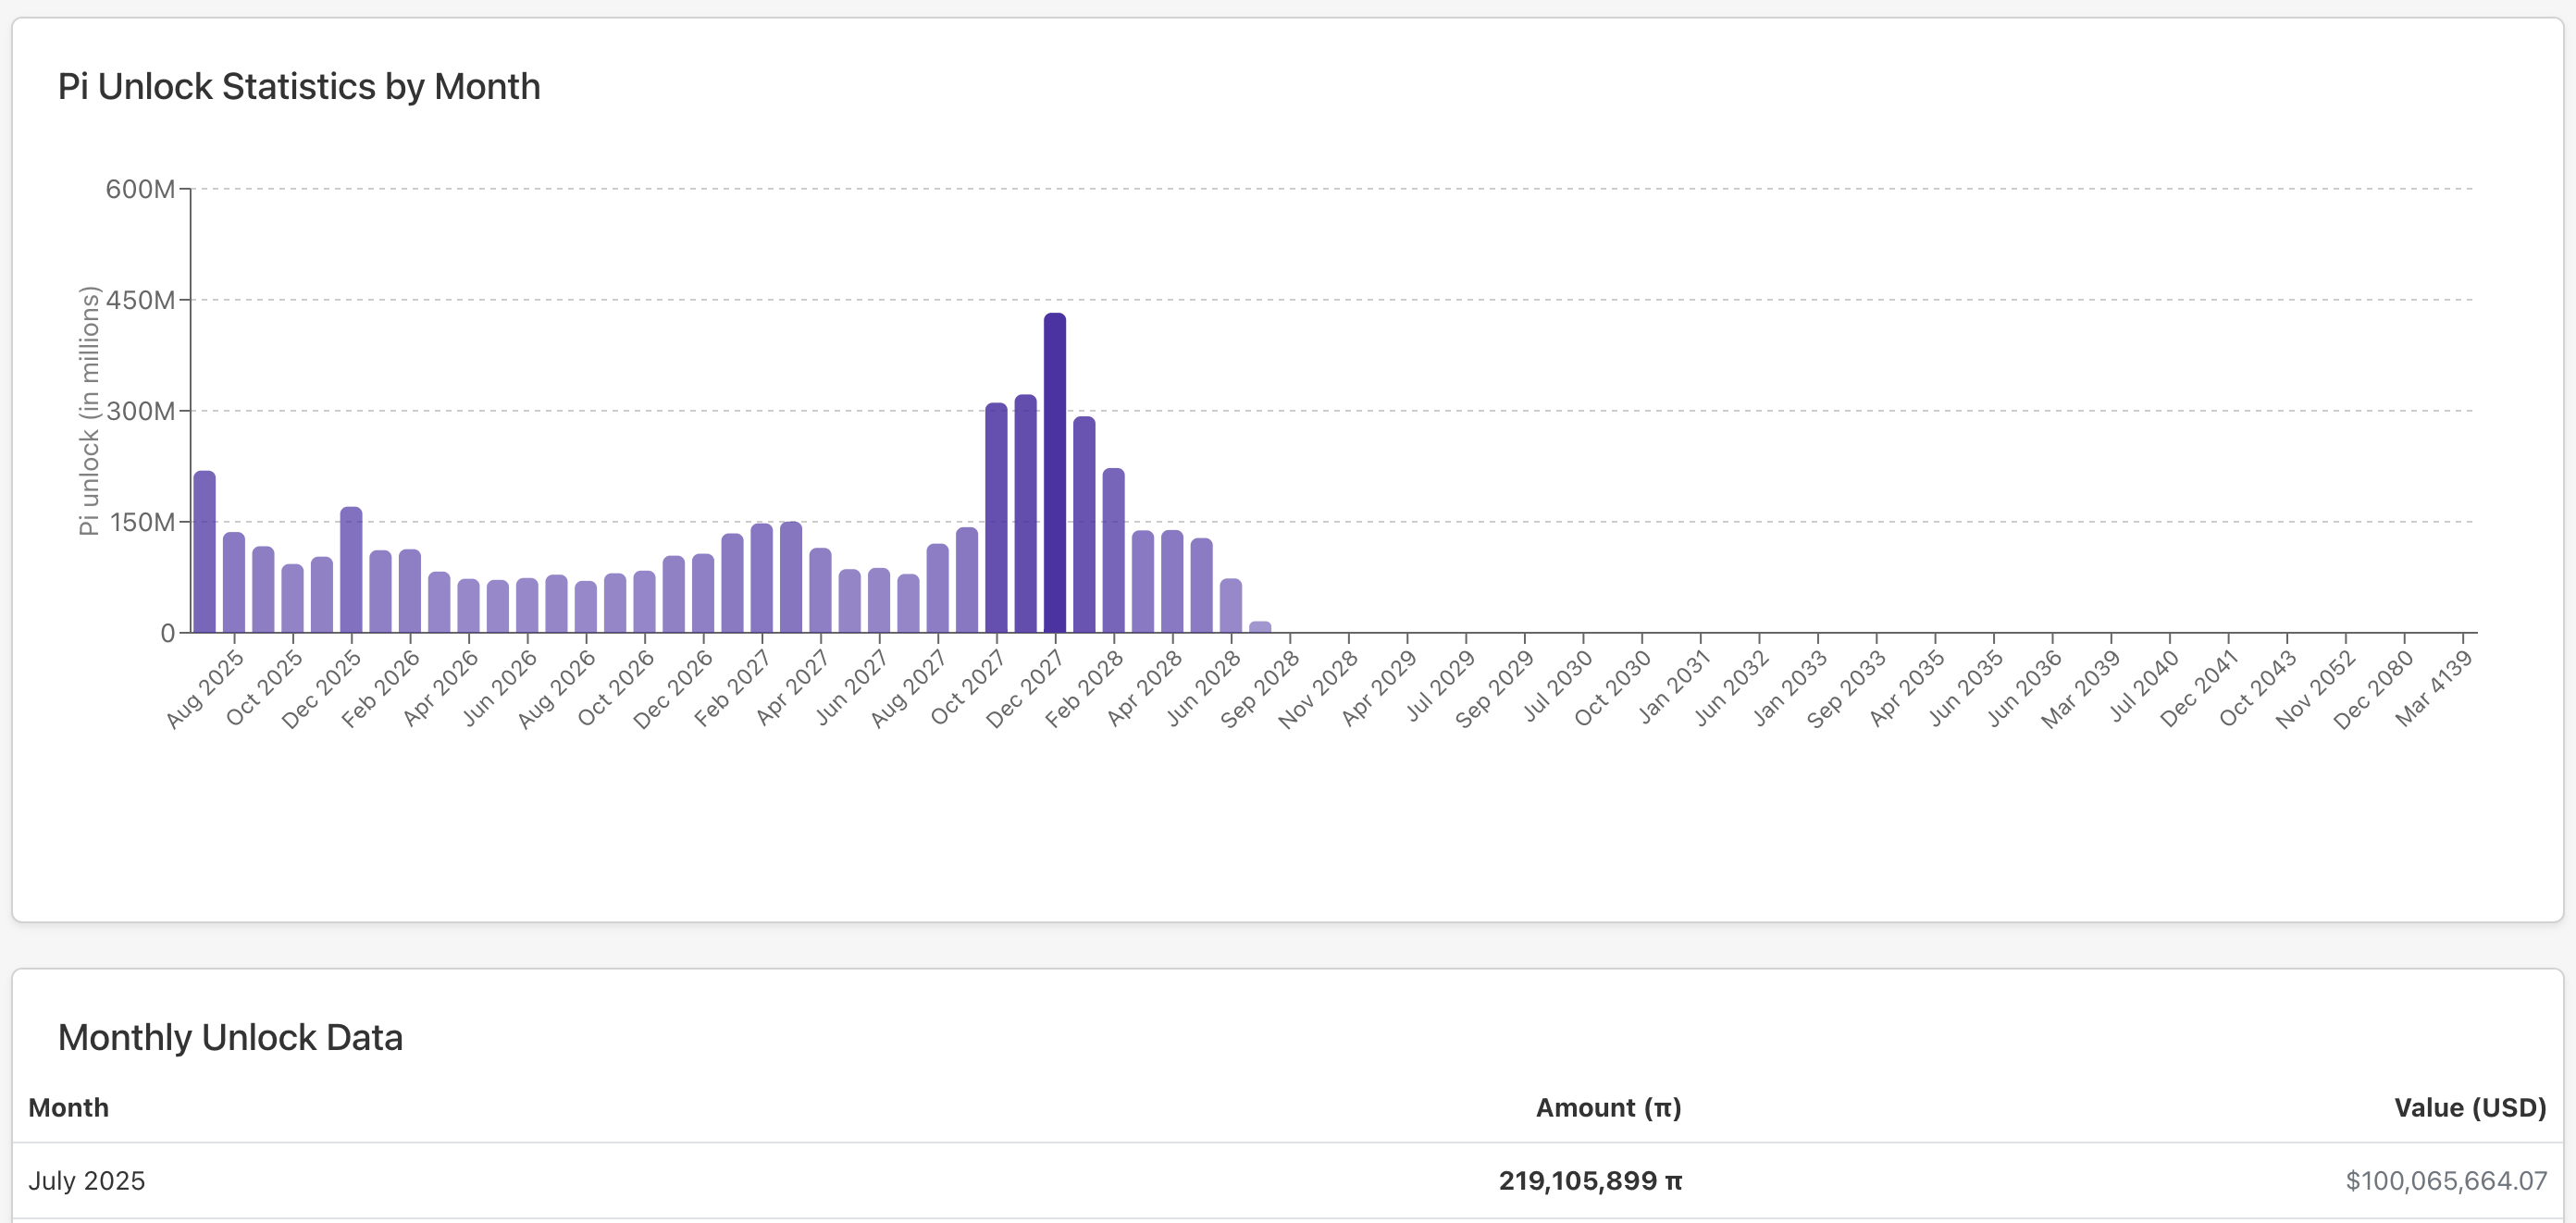
However, it’s important to note that Pi Network still faces significant token unlock pressure this month. According to PiScan, a total of about 219 million PI will be unlocked throughout July, with the day-one unlock on July 4 already releasing 19.2 million PI into circulation. This influx represents roughly 4 % of current circulating supply, and the large volume of to-be-unlocked tokens could trigger further sell pressure.