
XRP has delivered a sharp bullish breakout after spending months inside a persistent downtrend. The impulsive move has dramatically improved the short-term structure, although the price is already testing a significant resistance area after becoming highly extended.
XRP Price Analysis: The Daily Chart
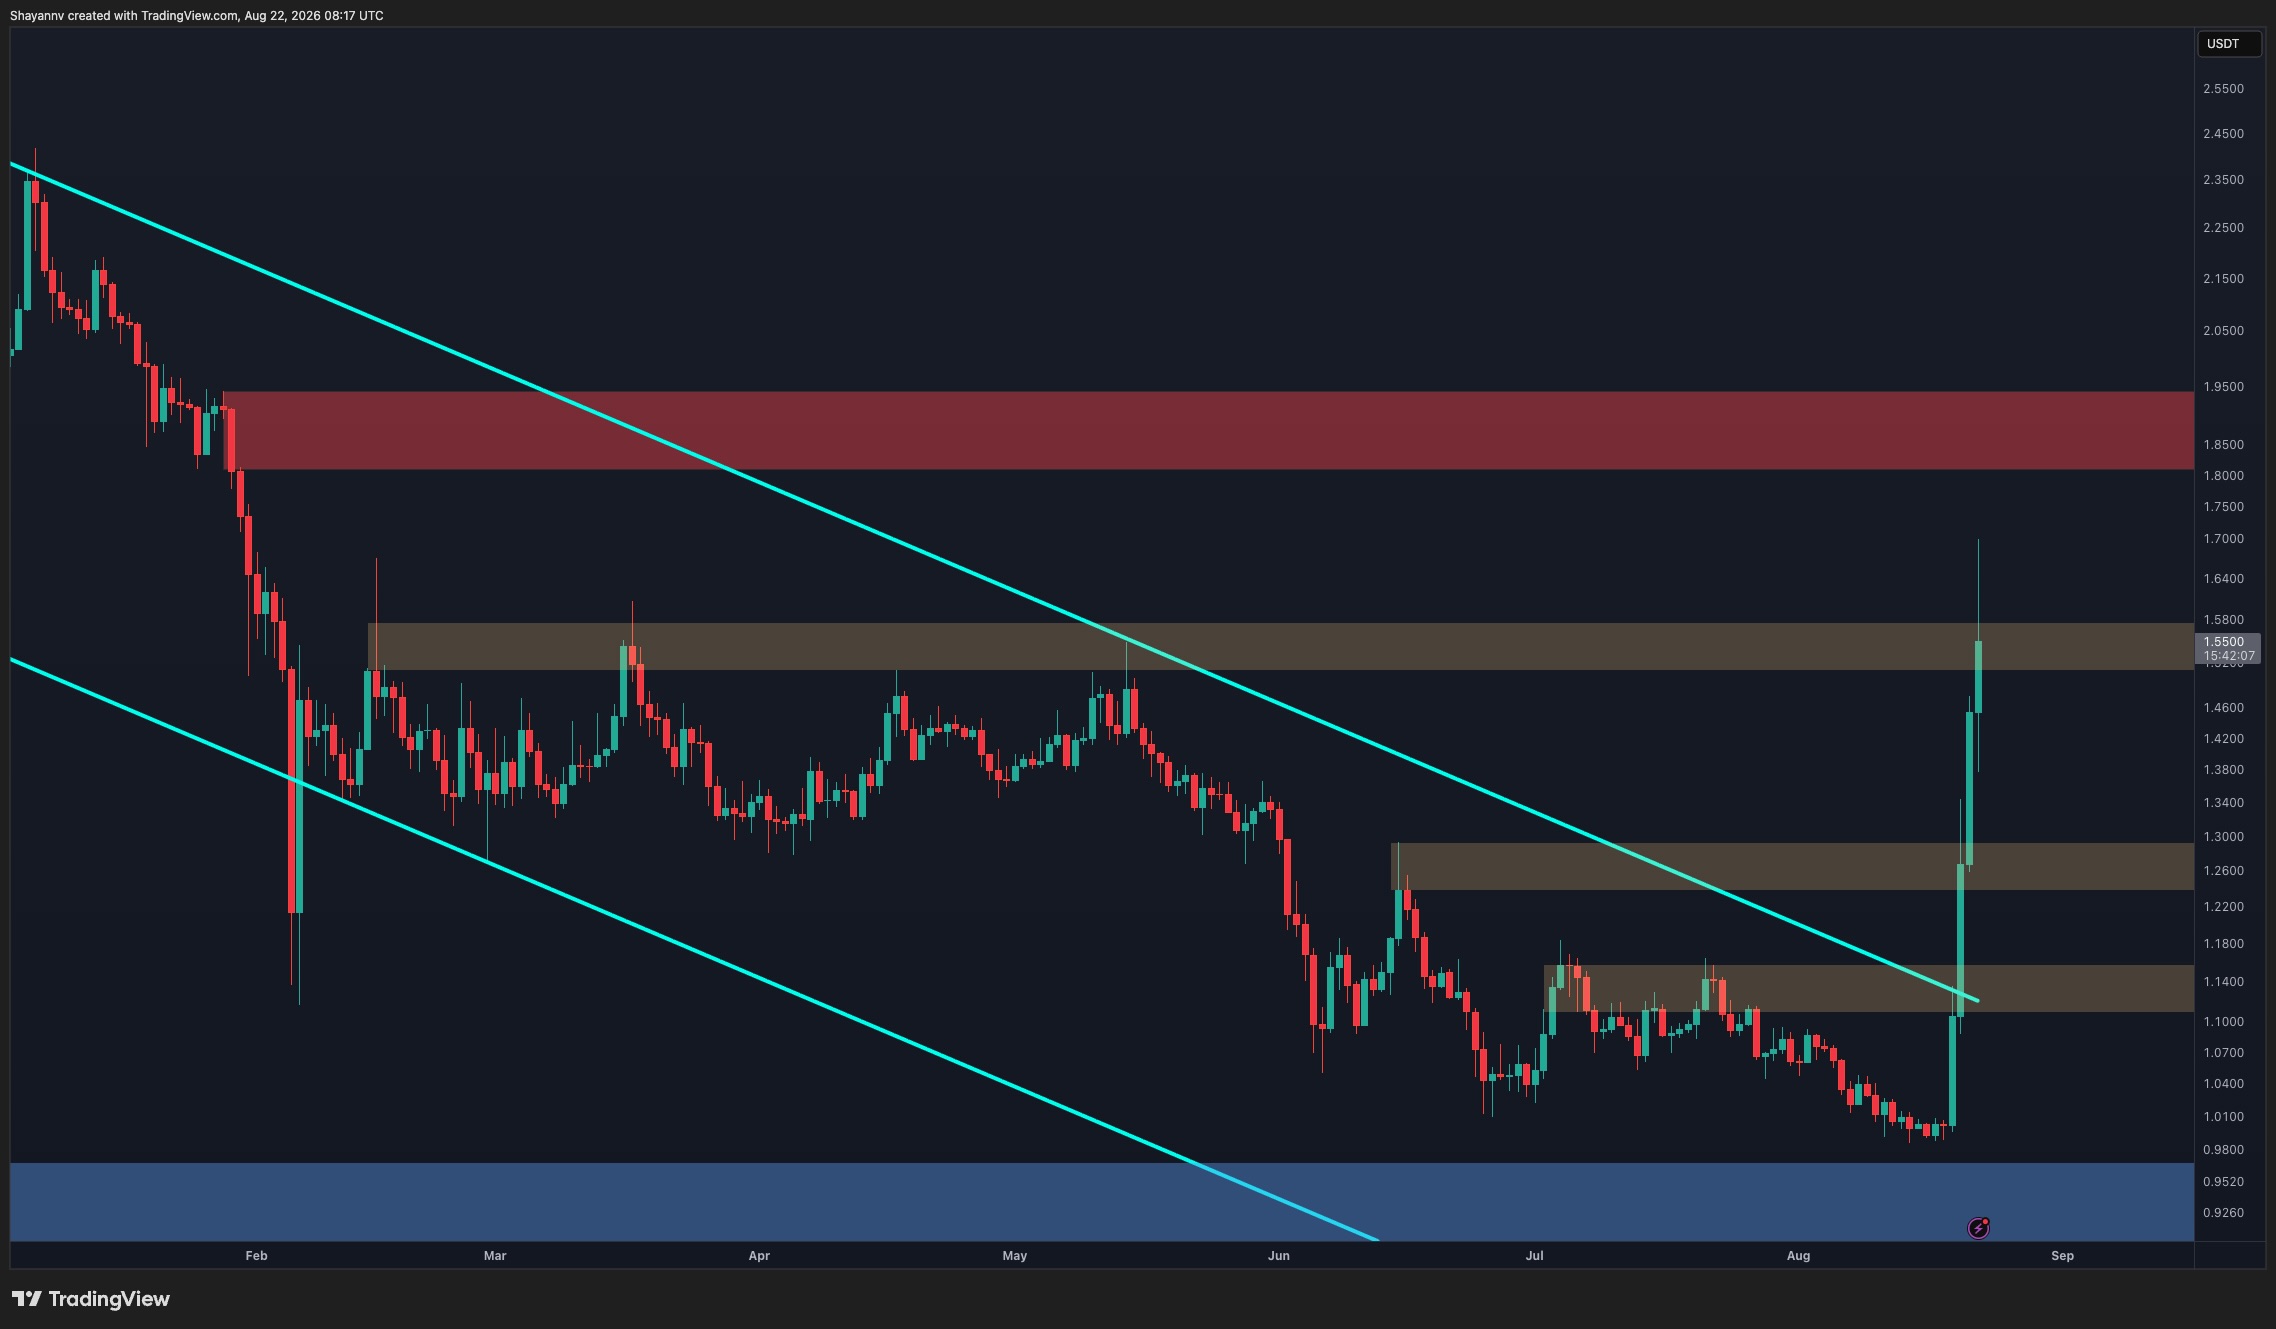
On the daily timeframe, the token has decisively escaped the descending channel that had governed price action for several months. The breakout originated from around the $0.98-$1 support region and quickly carried the asset through multiple resistance zones, including the descending channel boundary and the $1.10-$1.15 area.
The rally has since extended toward $1.55, bringing XRP directly into the important $1.50-$1.58 resistance zone. The long upper wick toward roughly $1.70 shows that sellers have already responded at higher prices, suggesting some short-term profit-taking after the near-vertical advance.
Nevertheless, the broader structural change is significant. Holding above the former $1.50 region would strengthen the breakout and could eventually put the major $1.82-$1.94 resistance zone into focus. Conversely, failure to establish support around current levels could trigger a corrective phase, with $1.22-$1.30 serving as an important former resistance area to monitor.

XRP/USDT 4-Hour Chart
The 4-hour timeframe emphasizes how aggressive the latest move has been. XRP broke out from around $1 and surged as high as $1.70 with almost no meaningful consolidation, leaving the market vulnerable to a retracement as the initial momentum cools.
The Fibonacci retracement levels highlight several potential support areas if a correction develops. The first major region is around the 0.5 level at $1.34, which overlaps with the upper portion of the marked $1.22-$1.34 support zone. Below it, the 0.618 retracement sits at $1.26, followed by the 0.702 level at $1.20. A deeper pullback could bring the 0.786 level near $1.14 into play, close to another former resistance area.
For now, the rejection from $1.70 suggests the market may need to digest the explosive rally. As long as XRP holds the $1.22-$1.34 zone during a correction, the breakout structure appears constructive, and another attempt toward $1.70 could follow. A sustained loss of this area, however, would increase the probability of a deeper retracement toward $1.14-$1.10 before buyers regain control.

The post Ripple Price Analysis: Major Breakout Confirmed – How High Can XRP Go? appeared first on CryptoPotato.
Source: https://cryptopotato.com/ripple-price-analysis-major-breakout-confirmed-how-high-can-xrp-go/