
Solana price has retraced sharply from the $260 resistance mark, dropping into the $200 support zone. With the RSI now in oversold territory, traders are watching for a potential bounce.
Summary
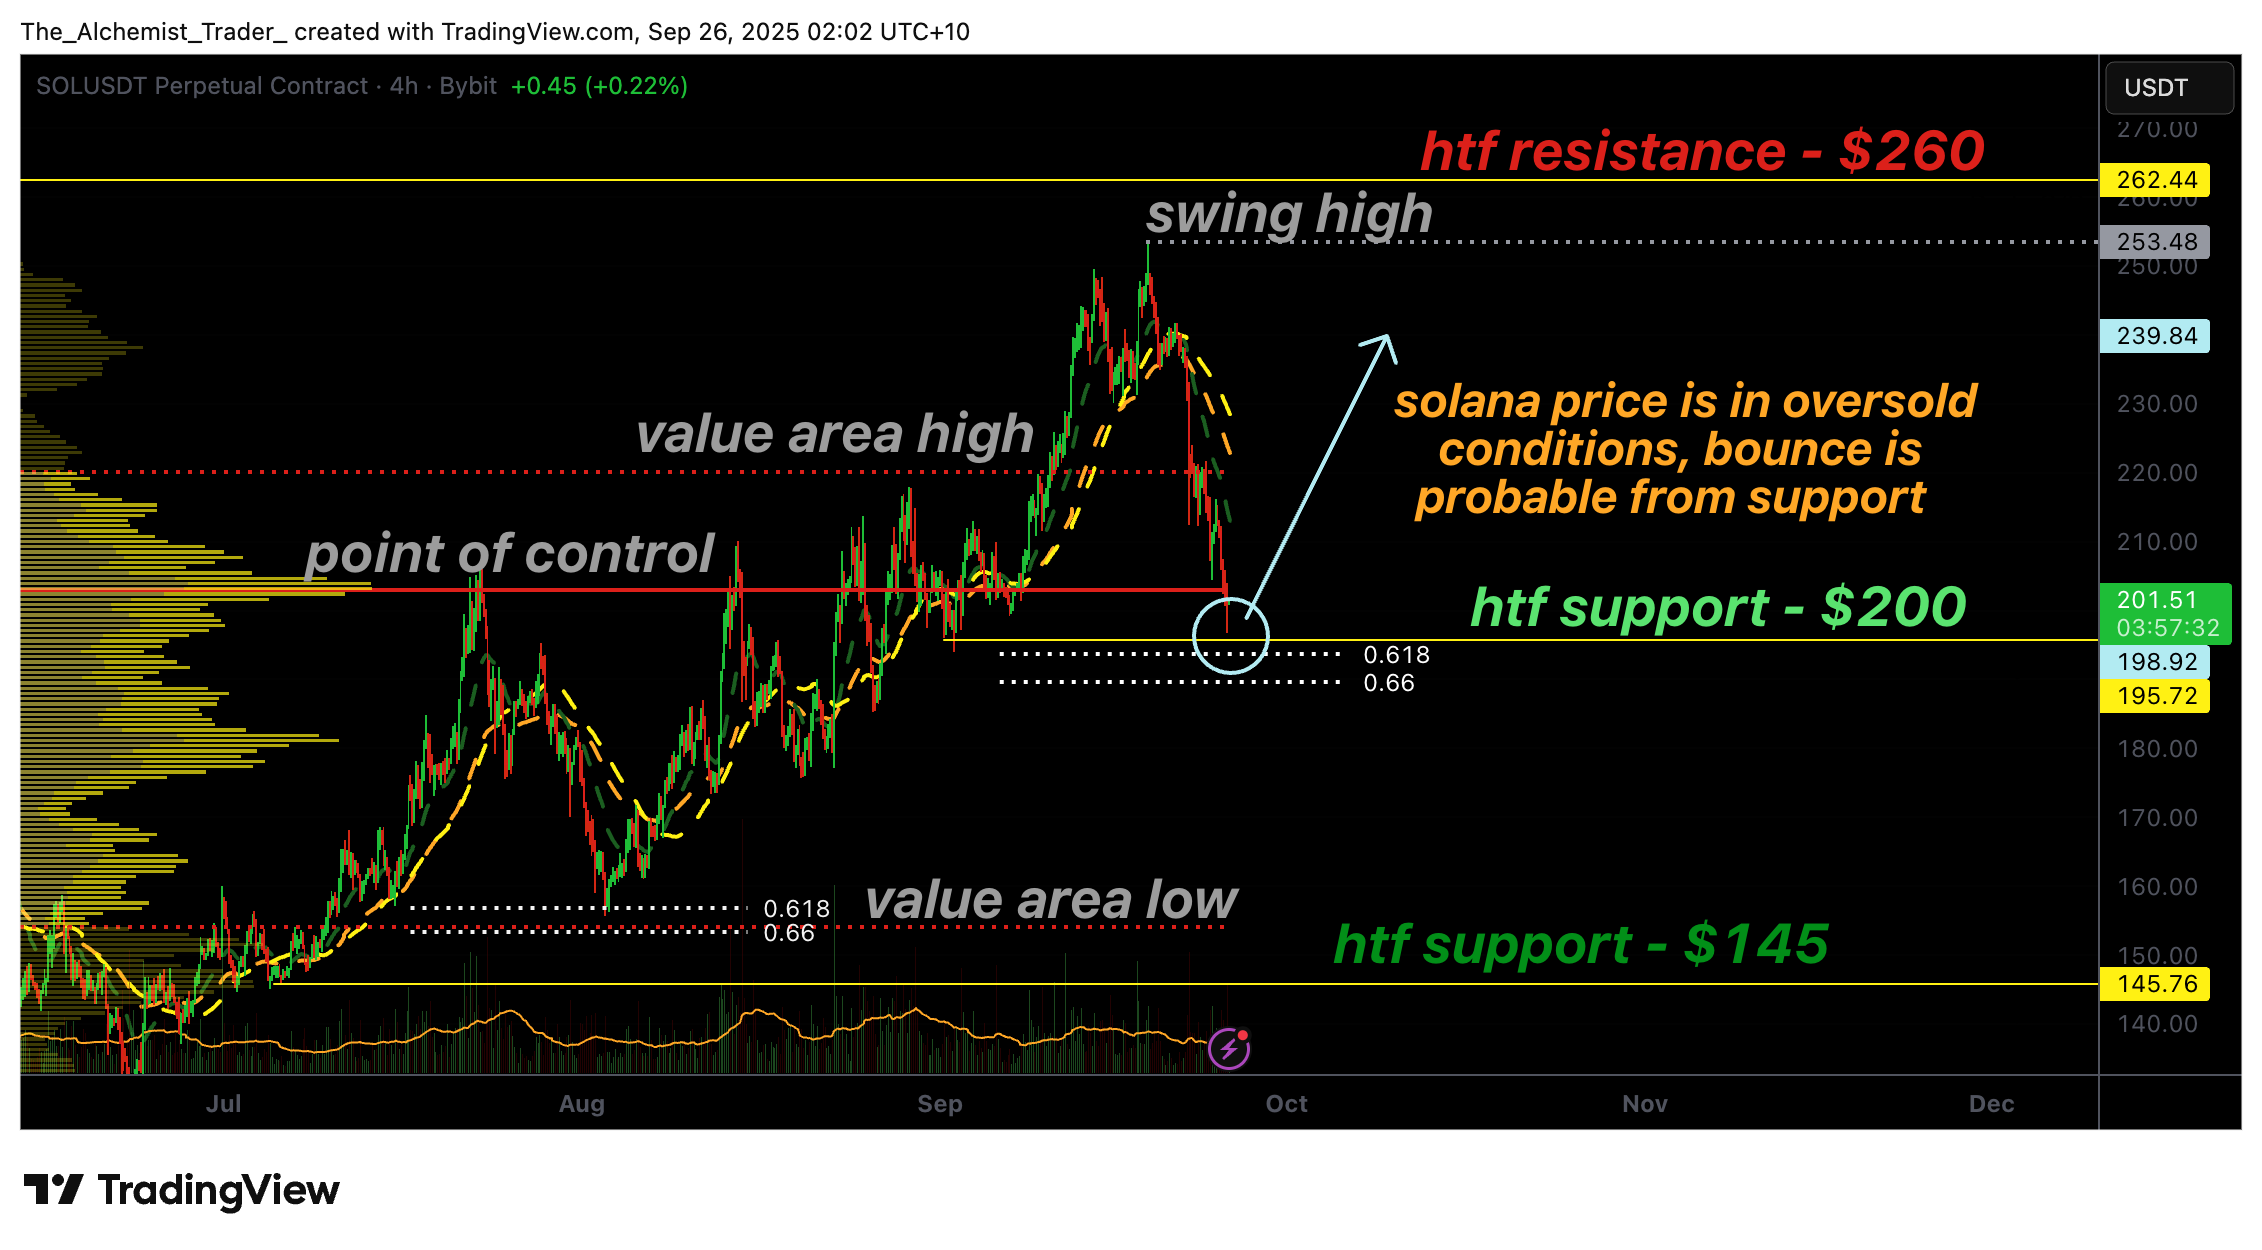
- Solana price has dropped from the $260 resistance level down to the $200 support region.
- The 0.618 Fibonacci retracement aligns with oversold RSI conditions, creating a strong technical confluence.
- If the $200 support holds, Solana has the potential to recover back toward the $230–$260 range.
Solana price action shifted swiftly after topping out just under $260. A sequence of higher highs and higher lows established a bullish structure until resistance capped the advance. The rejection sparked an aggressive sell-off, cutting through the point of control (POC) and the value area high (VAH) before finding footing at the $200 region.
This zone coincides with the high-time-frame 0.618 Fibonacci retracement, an area where Solana has historically reacted with strong reversals. Adding to the narrative, Kazakhstan is introducing a stablecoin backed by Solana, Mastercard, and a major local bank, which could further strengthen Solana’s long-term outlook.
Solana price key technical points
- Support Test: Price crashes to the $200 region, aligning with 0.618 Fibonacci confluence.
- RSI Oversold: The indicator now signals below 30, highlighting exhaustion of selling pressure.
- Potential Rotation: Historical patterns suggest Solana often bounces from 0.618 levels toward prior highs.

The recent bearish expansion was sharp and aggressive, mirroring prior moves where Solana respected the 0.618 Fibonacci retracement as a key turning point. This high-time-frame support provides a technically significant level that could attract buyers looking for value after the sell-off.
From a structural perspective, the $200 support carries more weight than just Fibonacci alignment. It also reflects a psychological round-number level where liquidity pools tend to form. A bounce here could reestablish Solana’s bullish trajectory by rotating price action back toward neutral volume levels such as the VAH and eventually retesting the $260 resistance mark.
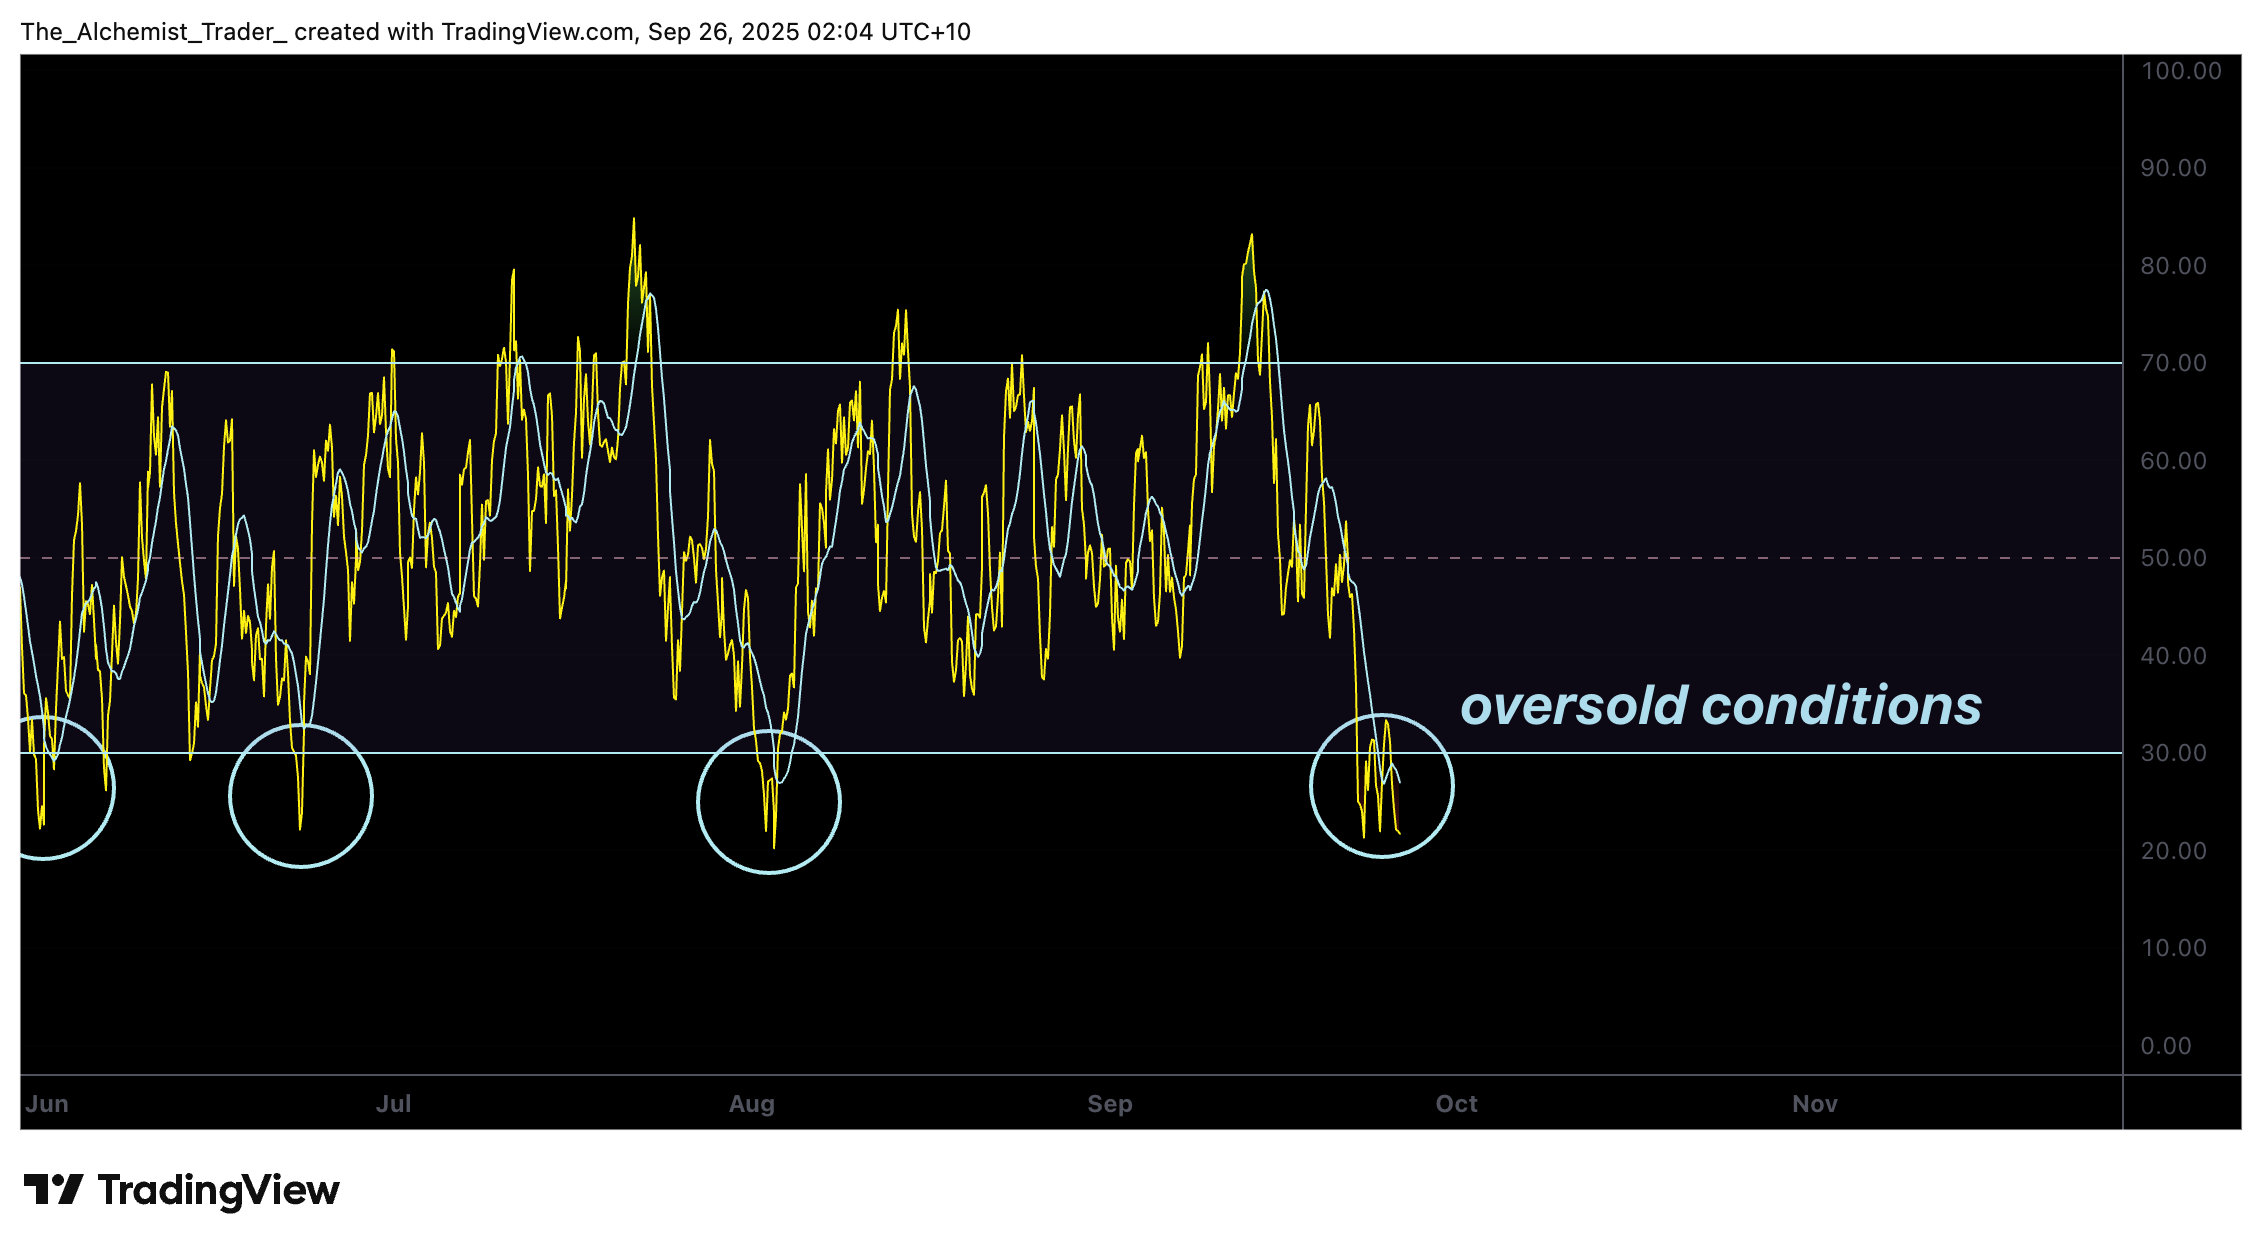
Momentum indicators further support this narrative. The RSI, currently below the 30 threshold, shows oversold conditions that are rarely sustained for long. In past cycles, breaches of this level have consistently led to relief rallies, driven by short covering and opportunistic entries from bulls.
Volume analysis will be critical in confirming this scenario. If demand inflows return at these lows, it could mark the exhaustion of the current bearish leg and set the stage for another bullish impulse. However, failure to defend $200 may expose deeper liquidity levels, with the next supports lying below.
Adding to the broader ecosystem, PancakeSwap now supports Solana in its cross-chain swaps, enabling users to trade tokens across blockchains in a single transaction.
What to expect in the coming price action
In the short term, Solana’s oversold RSI and strong support at $200 favor a rebound scenario. A successful defense of this zone could trigger a rotation toward $230–$260.