

Ethereum is pressing against a double-top resistance zone at $2,163 after two consecutive rejections from the upper boundary of its rising parallel channel, while a marginal bullish MACD crossover on the 4H chart raises the question of whether buyers can finally break through or whether the pattern will resolve to the downside toward $1,980.
Summary
- Ethereum is trading at $2,051.80, holding inside a rising parallel channel on both the daily and 4H timeframes after twice rejecting from the $2,163-$2,166 resistance zone.
- The 4H MACD histogram has just turned positive to 1.19, signalling a bullish crossover, while the daily Supertrend at $1,980.92 remains green, indicating the broader trend structure has not yet broken.
- A confirmed daily close above $2,166 targets $2,250-$2,300, while a loss of $2,024 Supertrend support opens the door to $1,980 and potentially $1,900.
Ethereum (ETH) is trading at $2,051.80 on April 3, 2026, holding inside a rising parallel channel that has been intact since the February lows. Two consecutive rejection candles at the $2,163-$2,166 zone, marked clearly on both the 4H and daily charts, have created a double-top structure at the channel’s upper boundary. With $6.3 billion in Ethereum options having expired today and CME futures offline for Good Friday, traders face a thin-liquidity weekend that could amplify any directional move.
On the 4H chart, Ethereum is trading between the channel’s lower support near $2,024 and the upper resistance at $2,163. The 4H Supertrend at $2,024.73 is still green, confirming the short-term trend has not flipped bearish. More notably, the 4H MACD histogram has just crossed into positive territory at 1.19, with the MACD line at -3.39 crossing above the signal line at -4.58. This is a marginal but technically meaningful bullish crossover, the first since mid-March.
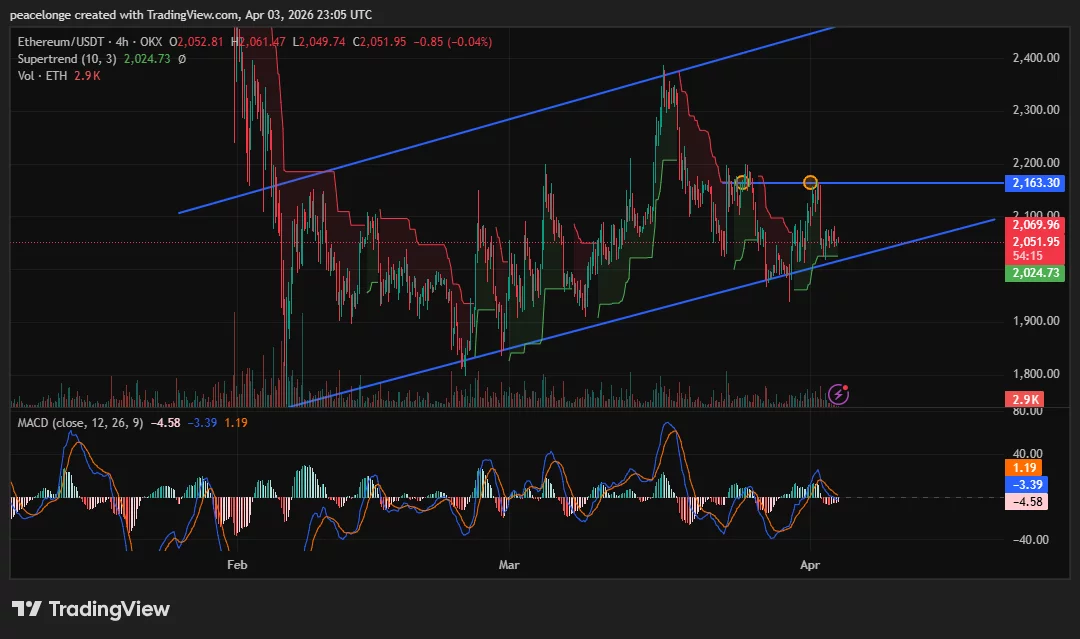
On the daily chart, the picture is more cautious. The MACD histogram sits at -7.33, with the MACD line at -11.11 still below the signal at -3.78. The daily Supertrend at $1,980.92 remains green, meaning the daily trend has not broken bearish. Two orange markers on the chart precisely identify the double-top rejection zone at $2,163-$2,166. A daily close above $2,166 would invalidate the double-top and confirm the rising channel’s upper trendline as the next target.
Key Levels, Price Targets, and Invalidation
Support is layered at $2,024 (4H Supertrend) and $1,980 (daily Supertrend). A daily close below $1,980 would flip the daily Supertrend bearish and break the rising channel structure that has defined price since February, opening a move toward $1,900 as the next major floor.
Resistance: the $2,069 area (the 4H Supertrend upper band visible on the chart) acts as a near-term ceiling, then the double-top zone at $2,163-$2,166. A clean daily close above $2,166 targets $2,250 initially, with $2,300-$2,400 as the broader bull case if the channel’s upper trendline is the objective.
Invalidation for the bullish channel thesis: a 4H close below $2,024 Supertrend support. Invalidation for the bearish double-top thesis: a daily close above $2,200.
Options Expiry and Macro Context
Approximately $6.3 billion in Ethereum options expired on April 3, according to data from Deribit, with spot price trading near the max pain zone for the expiry. Analysts at AnalyticsInsight noted the event is “more like a routine settlement than a major turning point,” given price proximity to max pain, limiting the probability of an expiry-driven spike in either direction.
As crypto.news reported, Ethereum fell 3.4% toward the $2,000 support on April 2 during the broader market selloff tied to U.S.-Iran escalation and the $285 million Drift Protocol exploit on Solana. The fact that the 4H Supertrend held at $2,024 through that sell event is a meaningful signal of buyer resilience at that level.
A sustained hold above $2,024 heading into next week, particularly with the 4H MACD histogram staying positive, would be the first concrete signal that bulls are retaking short-term control. If $2,024 fails, the double-top breakdown and a move toward $1,900 become the primary scenario to watch.