

XRP price fell 5% from last week’s high, driven down by declining network activity and cooling retail interest. It has now formed a bearish pennant pattern that positions the token for more pain in the coming sessions.
Summary
- XRP price fell about 5% to $1.39, extending losses to nearly 40% from its January peak as network activity and retail participation declined.
- XRP Ledger metrics weakened, with fees dropping to $34.9K this month, daily transactions falling to ~212K, and active users slipping to 168K.
- Bearish pennant pattern and negative Chaikin Money Flow signal continued downside risk, with $1 identified as the next key support level.
According to data from crypto.news, XRP (XRP) price fell 5% from last Wednesday’s high to $1.39 at press time, while its market cap dropped to $85.8 billion. At its current price, the token is down nearly 40% from its year-to-date high of $2.36 reached in early January.
XRP price fell alongside a visible slowdown in XRP Ledger activity. Network revenue has remained subdued, with the protocol generating just $34,900 in fees so far this month. That follows $75,000 in the first quarter, down from $128,000 in the previous quarter, pointing to reduced usage despite the project’s large valuation.
Transaction metrics also show a clear decline. Daily payment transactions on the XRP Ledger have fallen to around 212,856, a sharp drop from the millions recorded a few months ago. Active user count has continued to slide as well, currently standing at about 168,000.
At the same time, the network’s burn rate has eased further. Only around 400 XRP tokens, valued at less than $600, are being burned each day. A slower burning rate reduces the deflationary pressure on the circulating supply and makes it harder for the price to sustain upward momentum.
XRP price analysis
On the weekly chart, XRP price has formed a bearish pennant pattern, a technical setup consisting of a flagpole with a symmetrical triangle pattern that typically signals a continuation of the previous downward trend.
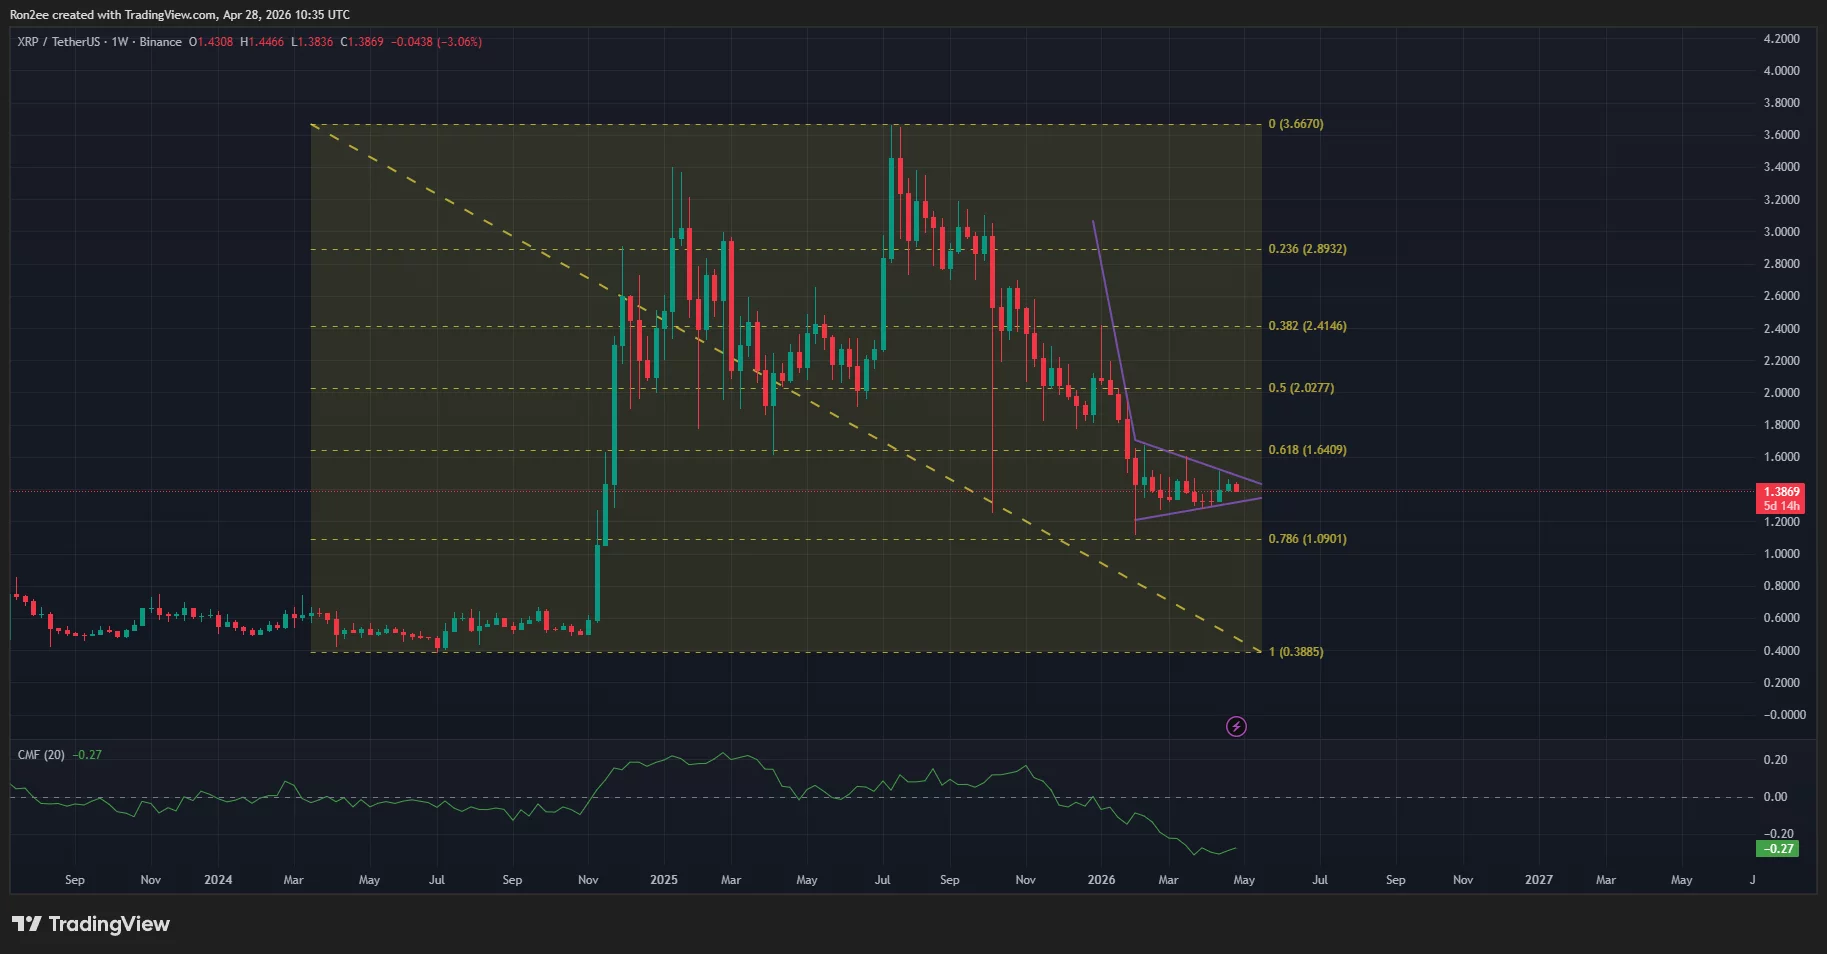
XRP price action has also slipped below the 61.8% Fibonacci retracement level, a threshold traders often watch to confirm downside continuation. Furthermore, the Chaikin Money Flow index has fallen to a negative reading, suggesting that capital is flowing out of the asset as whales and institutional investors trim their positions.
Given these signals, the near-term outlook remains tilted to the downside. The next major level to monitor sits around $1. A break below that zone could open the door to deeper losses, potentially toward psychological support levels seen late last year.
Disclosure: This article does not represent investment advice. The content and materials featured on this page are for educational purposes only.